- Published on ·
- Reading time 7 min read
Using GitHub's GeoJSON for Your Mapping Requirements
How the Ministry of Health NZ displays covid locations of interest on their website
Share this page
GeoJSON is an open standard geospatial data interchange format that represents simple geographic features and their non-spatial attributes based on JavaScript Object Notation (JSON). It uses a geographic coordinate reference system, World Geodetic System 1984, and units of decimal degrees.
GitHub supports rendering GeoJSON files within GitHub repositories and in Gists. If you'd like to try out any of the snippets from this article by yourself, either create a file in your GitHub repository with the file extension .geojson (or .topojson) or create a Gist with the file extension .geojson. Once you commit (i.e. save) your changes, you should be able to preview the map right away. If you'd like to read the full specification of GeoJSON, you may find it here.
GeoJSON online tool
Before we get into the details of GeoJSON, I came across this online tool which allows you to plot points and areas on a map and also see the generated GeoJSON file for it. Throughout the article, I'd highly recommend using this tool to learn about GeoJSON's features.
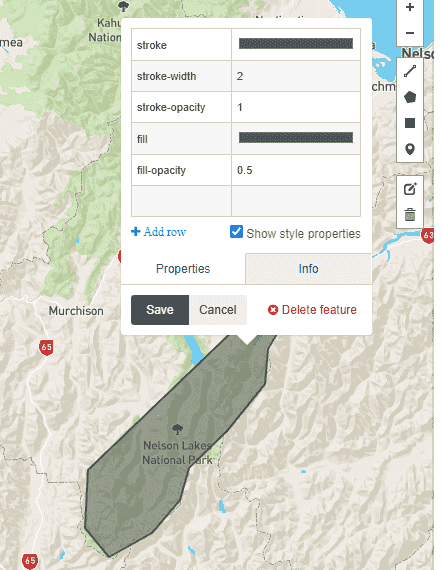
As evident in the screenshot below, it not only allows you to plot a feature on a map but you can also configure the properties and metadata for the feature. Each feature has a set of distinct style properties that affect how the feature is displayed on the map. For example, a polygon area might have a fill colour but a point may not have the same.
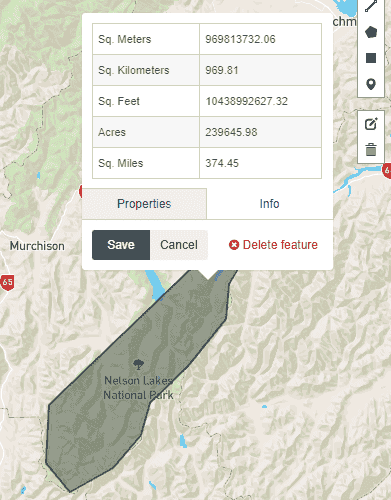
Clicking on the Info tab from the pop up will give you the area of the selected feature, which is pretty useful.
Features
Point
Plotting markers on the map is super easy. In the geometry block, just add the coordinates of where you'd want your marker to be. Coordinates are the latitude and longitude of the location.
{
  "type": "FeatureCollection",
  "features": [
    {
      "type": "Feature",
      "properties": {},
      "geometry": {
        "type": "Point",
        "coordinates": [
          174.77809309959412,
          -41.285264253328606
        ]
      }
    }
  ]
}
The snippet above will produce a result like the following screenshot.
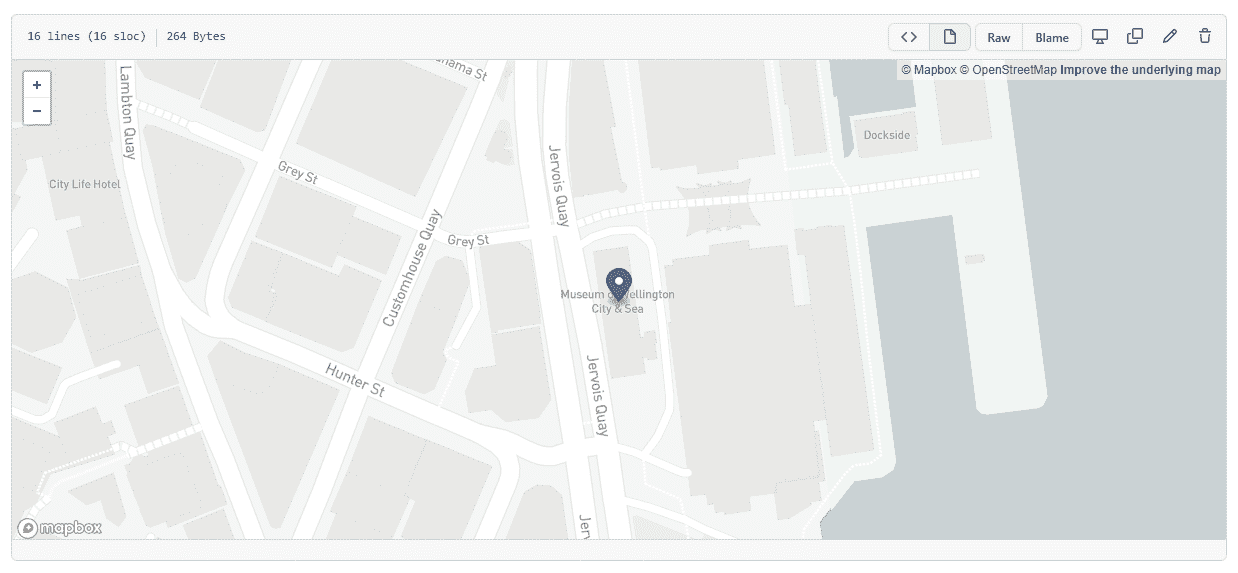
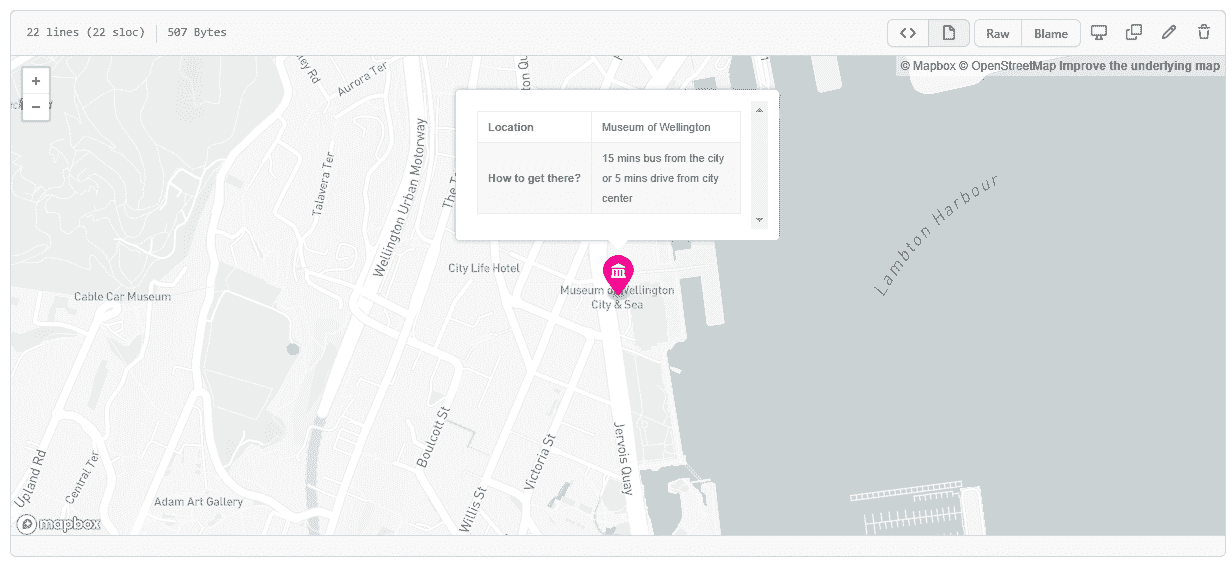
You can use the properties block to specify some metadata for that marker. In the snippet below, the properties with the prefix marker- are Point specific. Depending on what type of feature you decide to plot on the map, you'll have access to different built-in properties.
{
  "type": "FeatureCollection",
  "features": [
    {
      "type": "Feature",
      "properties": {
        "marker-color": "#ff0095",
        "marker-size": "large",
        "marker-symbol": "museum",
        "Location": "Museum of Wellington",
        "How to get there?": "15 mins bus from the city or 5 mins drive from city center"
      },
      "geometry": {
        "type": "Point",
        "coordinates": [
          174.77809309959412,
          -41.285264253328606
        ]
      }
    }
  ]
}
Adding the various properties for this point not only gives it a different style but also adds metadata that will be displayed when you click on the point.
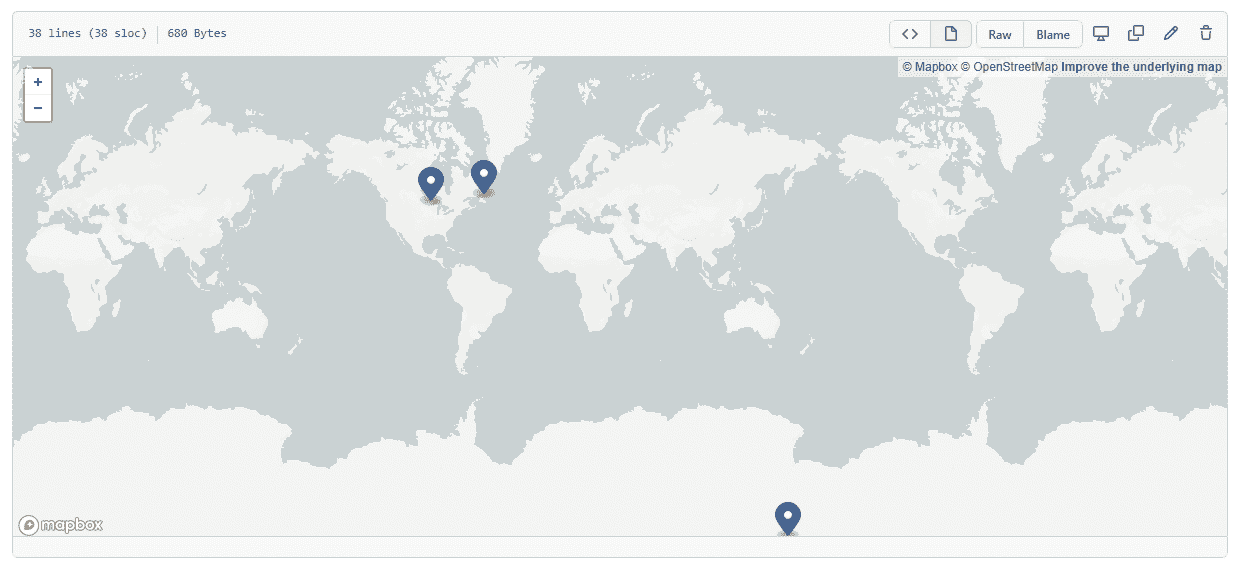
Multiple points
If you'd like to display multiple points on a map, just duplicate the contents of the feature block and update the coordinates accordingly. The features block is an array of objects which means it can hold either a single feature or multiple features, in this case, either a single point or multiple points. The same logic applies to other features as well, which we'll revisit later in this article.
{
  "type": "FeatureCollection",
  "features": [
    {
      "type": "Feature",
      "geometry": {
        "type": "Point",
        "coordinates": [
          -92.27918276398681,
          48.39592955328644
        ]
      },
      "properties": {}
    },
    {
      "type": "Feature",
      "geometry": {
        "type": "Point",
        "coordinates": [
          158.98942190304547,
          -85.56932970610792
        ]
      },
      "properties": {}
    },
    {
      "type": "Feature",
      "geometry": {
        "type": "Point",
        "coordinates": [
          -55.141767637538585,
          51.59283957486469
        ]
      },
      "properties": {}
    }
  ]
}
The snippet above will produce the following result.
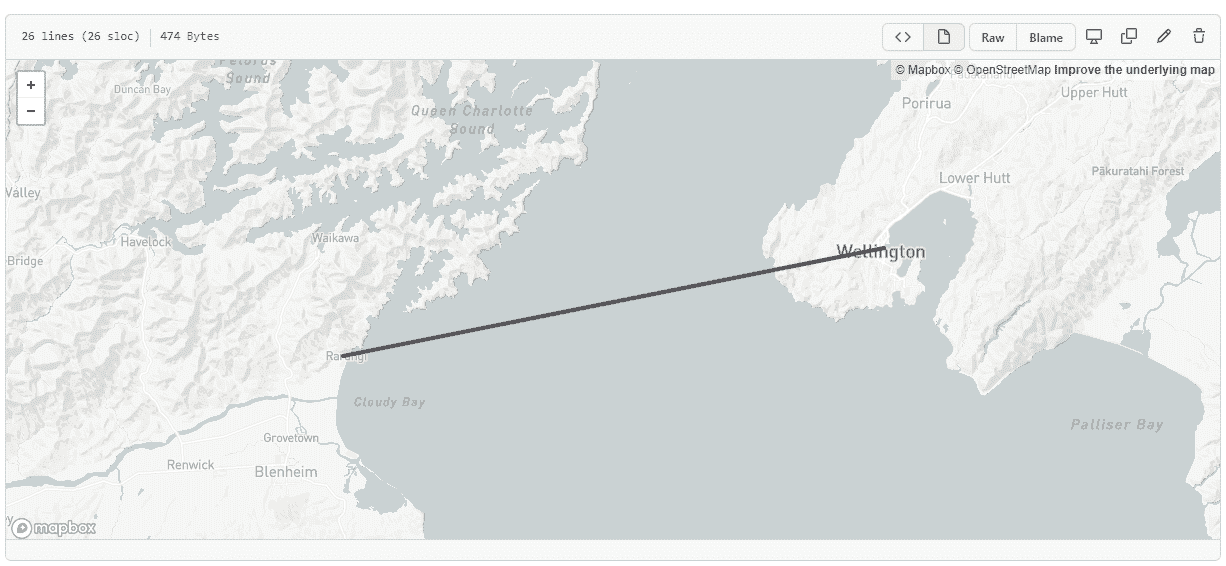
Line
For a line, you'll need to supply two sets of coordinates and GitHub will connect them both forming a line. The properties in the snippet below are line specific.
{
  "type": "FeatureCollection",
  "features": [
    {
      "type": "Feature",
      "properties": {
        "stroke": "#555555",
        "stroke-width": 4,
        "stroke-opacity": 1
      },
      "geometry": {
        "type": "LineString",
        "coordinates": [
          [
            174.781494140625,
            -41.285030454601916
          ],
          [
            174.03854370117188,
            -41.39638489653628
          ]
        ]
      }
    }
  ]
}
The snippet above will produce the following output.
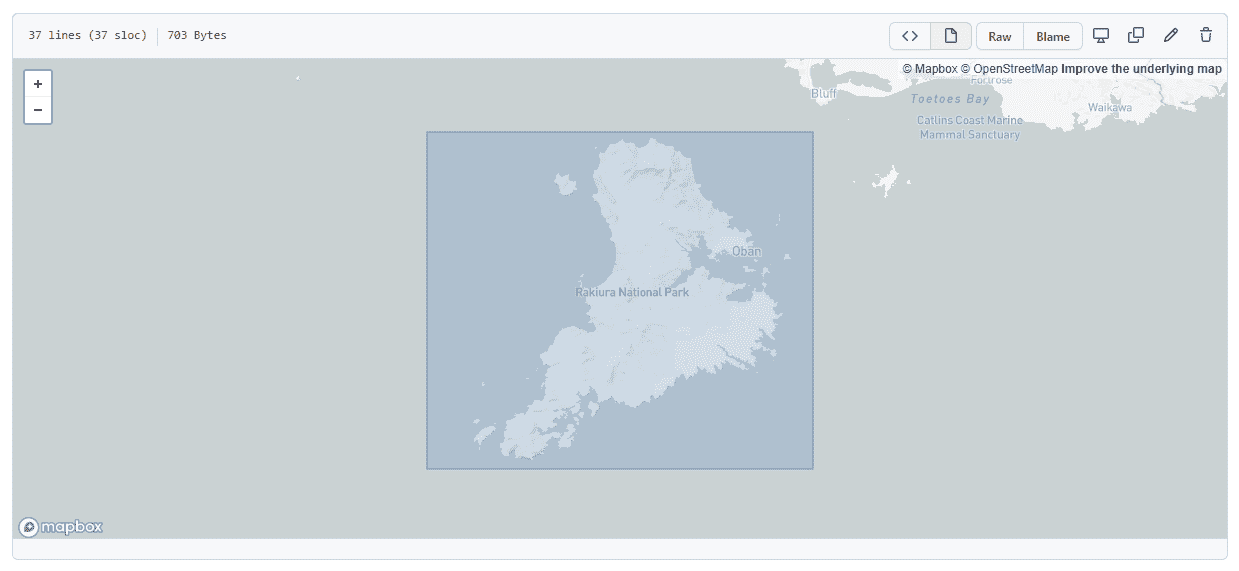
Rectangle
To plot a rectangle, you'll need to supply four sets of coordinates. Note, that the geometry type is still Polygon because a rectangle is just like any other area except it has four sets of coordinates at right angles with parallel sides.
{
  "type": "FeatureCollection",
  "features": [
    {
      "type": "Feature",
      "properties": {},
      "geometry": {
        "type": "Polygon",
        "coordinates": [
          [
            [
              167.2503662109375,
              -47.30530951077586
            ],
            [
              168.310546875,
              -47.30530951077586
            ],
            [
              168.310546875,
              -46.67394106549698
            ],
            [
              167.2503662109375,
              -46.67394106549698
            ],
            [
              167.2503662109375,
              -47.30530951077586
            ]
          ]
        ]
      }
    }
  ]
}
The above snippet produces the following result.
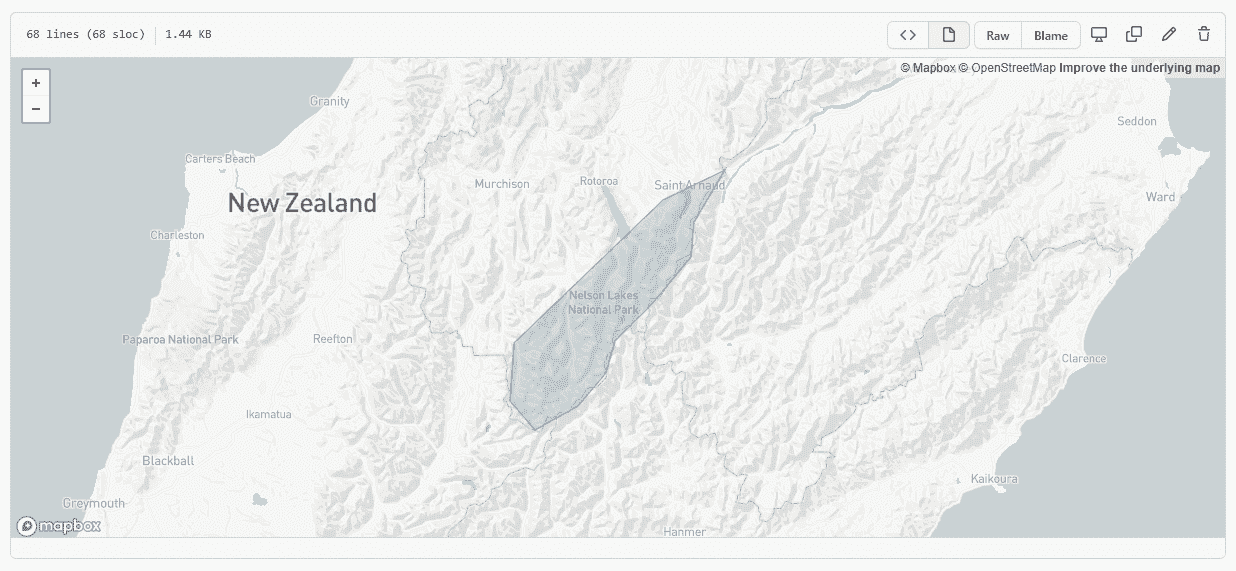
Polygon
For a polygon, the code snippet looks very similar to that of a rectangle. The rendered output just doesn't have four sets of coordinates at right angles with parallel sides.
{
  "type": "FeatureCollection",
  "features": [
    {
      "type": "Feature",
      "properties": {},
      "geometry": {
        "type": "Polygon",
        "coordinates": [
          [
            [
              172.35214233398438,
              -42.24275208539065
            ],
            [
              172.41806030273438,
              -42.301690328244504
            ],
            [
              172.53753662109375,
              -42.25190128722989
            ],
            [
              172.61444091796875,
              -42.18579390537846
            ],
            [
              172.63778686523438,
              -42.11961732446699
            ],
            [
              172.74215698242185,
              -42.0441936181652
            ],
            [
              172.847900390625,
              -41.94825586972942
            ],
            [
              172.85614013671875,
              -41.87671893034394
            ],
            [
              172.9412841796875,
              -41.77028745790555
            ],
            [
              172.77099609375,
              -41.83171182161545
            ],
            [
              172.55813598632812,
              -41.981952616657146
            ],
            [
              172.36175537109375,
              -42.123691727324726
            ],
            [
              172.35214233398438,
              -42.24275208539065
            ]
          ]
        ]
      }
    }
  ]
}
The snippet above produces the following output.
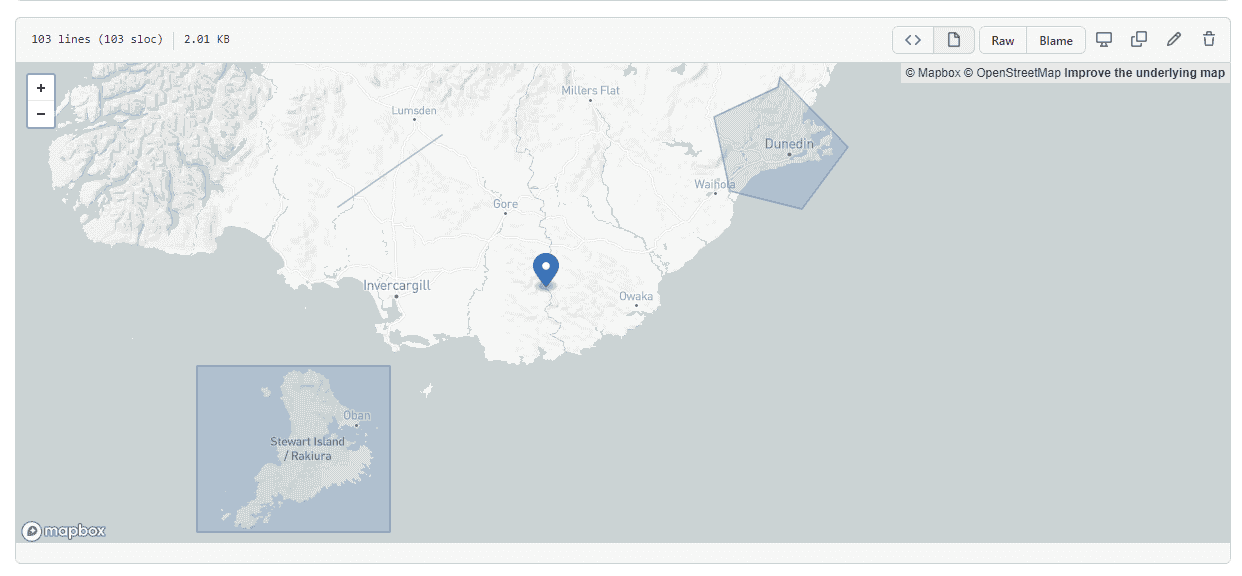
Rendering all features
You are not limited to rendering only a single type of feature. You can have a single GeoJSON file that has a combination of multiple points, lines, polygons and rectangles. The following snippet is an example of rendering different features.
{
  "type": "FeatureCollection",
  "features": [
    {
      "type": "Feature",
      "properties": {},
      "geometry": {
        "type": "Polygon",
        "coordinates": [
          [
            [
              167.2503662109375,
              -47.30530951077586
            ],
            [
              168.310546875,
              -47.30530951077586
            ],
            [
              168.310546875,
              -46.67394106549698
            ],
            [
              167.2503662109375,
              -46.67394106549698
            ],
            [
              167.2503662109375,
              -47.30530951077586
            ]
          ]
        ]
      }
    },
    {
      "type": "Feature",
      "properties": {},
      "geometry": {
        "type": "Polygon",
        "coordinates": [
          [
            [
              170.452880859375,
              -45.575600209478
            ],
            [
              170.44189453125,
              -45.614037411350914
            ],
            [
              170.09033203125,
              -45.729191061299915
            ],
            [
              170.17822265625,
              -46.01222384063236
            ],
            [
              170.57373046875,
              -46.08085173686784
            ],
            [
              170.826416015625,
              -45.84410779560203
            ],
            [
              170.452880859375,
              -45.575600209478
            ]
          ]
        ]
      }
    },
    {
      "type": "Feature",
      "properties": {},
      "geometry": {
        "type": "LineString",
        "coordinates": [
          [
            168.02490234375,
            -46.07323062540835
          ],
          [
            168.59619140624997,
            -45.798169530172636
          ]
        ]
      }
    },
    {
      "type": "Feature",
      "properties": {},
      "geometry": {
        "type": "Point",
        "coordinates": [
          169.16748046875,
          -46.377254205100265
        ]
      }
    }
  ]
}
This snippet produces the following output.
Embedding the map on your website
GitHub allows you to embed the map directly on your webpage. To do so, you'll need to copy the following snippet format into your website and replace the placeholders as required.
<script src="https://embed.github.com/view/geojson/<username>/<repo>/<ref>/<path_to_file>"></script>
So, if my GeoJSON file's URL is https://github.com/ClydeDz/geojson-demo/blob/main/allobjects-demo.geojson, then the embedded script would be the following.
<script src="https://embed.github.com/view/geojson/ClydeDz/geojson-demo/main/allobjects-demo.geojson"></script>
You can also suffix ?height=300&width=500 at the end of the script URL to update the height and width of the rendered map on your website.
Here is a JSFiddle to demonstrate embedding a GeoJSON map.
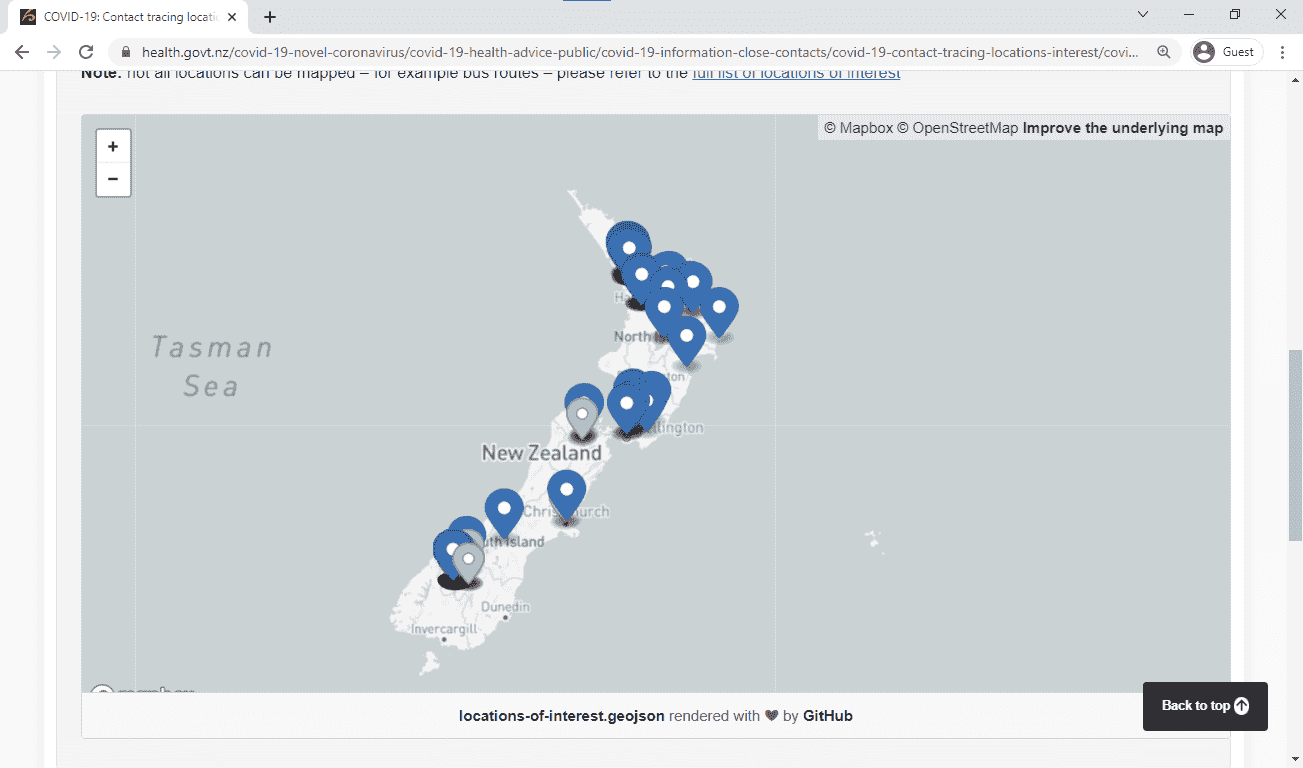
Real use case
The Ministry of Health New Zealand is using GitHub's GeoJSON file to show all of the locations of interest on their website. Any updates to the underlying GeoJSON file will reflect immediately on the next page load. The GitHub repository that contains this information is located here.
That's it! Thanks for reading.