- Published on ·
- Reading time 23 min read
The Shocking Environmental Price Tag of the Internet
Uncovering Internet carbon footprint, complexities and sustainable software engineering solutions
Share this page

Introduction
In today's day and age, we can't possibly fathom how we'd live without the internet. For a majority, our work lives revolve around some use of the internet — whether it's working remotely, building software or content that contributes to the internet ecosystem, or working on systems that are connected to the internet. And when we're not working, we might hop on one of the social media platforms for our daily dose of entertainment, or just binge-watch our favourite series on a streaming platform. Either way, we can safely say that we're well-connected!
But did you know that there's an environmental cost to meeting the ever-growing needs of the Internet? For instance, reading this article alone would've produced about produced about 0.45 grams CO₂e 1. And if you're an avid reader and have read ten such articles today, multiplying this number ten times would give us an estimate of 4.5 grams CO₂e emitted 2. Before you panic, let me also add that calculating emissions isn't this simple.
While this topic can get quite extensive and complex, I'm hoping the general takeaways from this article would be:
- Explore the correlation between digital content, software engineering, and carbon emissions.
- A simplified way of understanding how a website could be contributing to carbon emissions and how you could check this yourself.
- In the grand scheme of things, how big of an issue this is, what are some of the aspects that are driving this trend, and what are agencies doing about it?
- Understanding the complexity behind this subject and how it is surprisingly not straightforward to calculate the true carbon emissions of the files transmitted over the internet.
- Going forward, what are some practices you could follow to help propagate clean and sustainable development?
Discovering the relationship between digital content, software engineering, and carbon emissions could be eye-opening. A significant amount of readers could be learning about this for the first time and some aspects, if not all, might be quite surprising. Having this additional awareness could impact the way you approach software engineering problems in the future and if this article can contribute positively towards that, I'll consider that as a win. With that said, let's dive into this, shall we?
Chapter 1: How does a website produce carbon?
The internet requires electricity and the production of electricity has historically been dirty, i.e. generated by burning fossil fuels. It is dirty because burning these fossil fuels to generate energy results in the production of harmful greenhouse gases such as carbon dioxide, methane, and nitrous oxide, which in turn is responsible for global warming and climate change.
Let's say you own and manage a modestly popular website. Someone would've had to design and develop this website over time using a computer or a laptop. This website would then have to be hosted on a server — either on-premise or in the cloud, and every enhancement to the website would have to be transmitted over the wire to this server. When a person visits this website, a request is made to the server, and the required files are downloaded over the wire to the visitor's device. This is the lifecycle of your website — from development to consumption.
The carbon footprint of your website is therefore the cumulative total of the carbon footprint generated as a result of producing and operating the hardware, software, and infrastructure required to develop, host, and consume your website, the energy cost of storing data, the energy cost of data transfer, and the cost of electronic waste.
Now let's assume each page view produces 0.8 grams of CO₂ equivalent (or CO₂e). If we multiply this number by 10,000 monthly page views, that results in a massive 102 kg CO₂e emissions per year 3. That's approximately enough electricity to drive an electric car for 1,703 km or the amount of carbon 5 trees can absorb in a year!
If you're wondering what CO₂e is, you're not alone! Carbon dioxide equivalent (CO₂e) is a way of comparing emissions from all greenhouse gases, not just carbon dioxide. It allows us to bundle all these greenhouse gases into a common denominator which allows for easy comparison. For instance, if 1 kg of methane is emitted, this can be expressed as 29.8 kg of CO₂e because methane has a Global Warming Potential (GWP) of 29.8, or in other words, it causes 29.8 times more warming over 100 years compared to 1 kg of carbon which acts as the baseline with a GWP of 1.
Chapter 2: Calculating the carbon emissions of a website
There are several tools available to help us calculate the carbon emissions of a website. Most of these website carbon calculators focus on the page weight of the website, or in other words, the amount of data transferred to render that page, and then calculate the amount of energy consumed to transmit that data over the internet. The carbon estimate is a multiple of the energy consumed to transmit the data and the carbon intensity constant, where the carbon intensity of electricity measures the amount of CO₂e produced per unit of electricity. It is measured as the grams of CO₂e produced per kilowatt-hour (kWh).
For those interested, this interactive activity produced by Benjamin Ninassi is a fun way to learn and test your knowledge about the general weight of different elements on a web page.
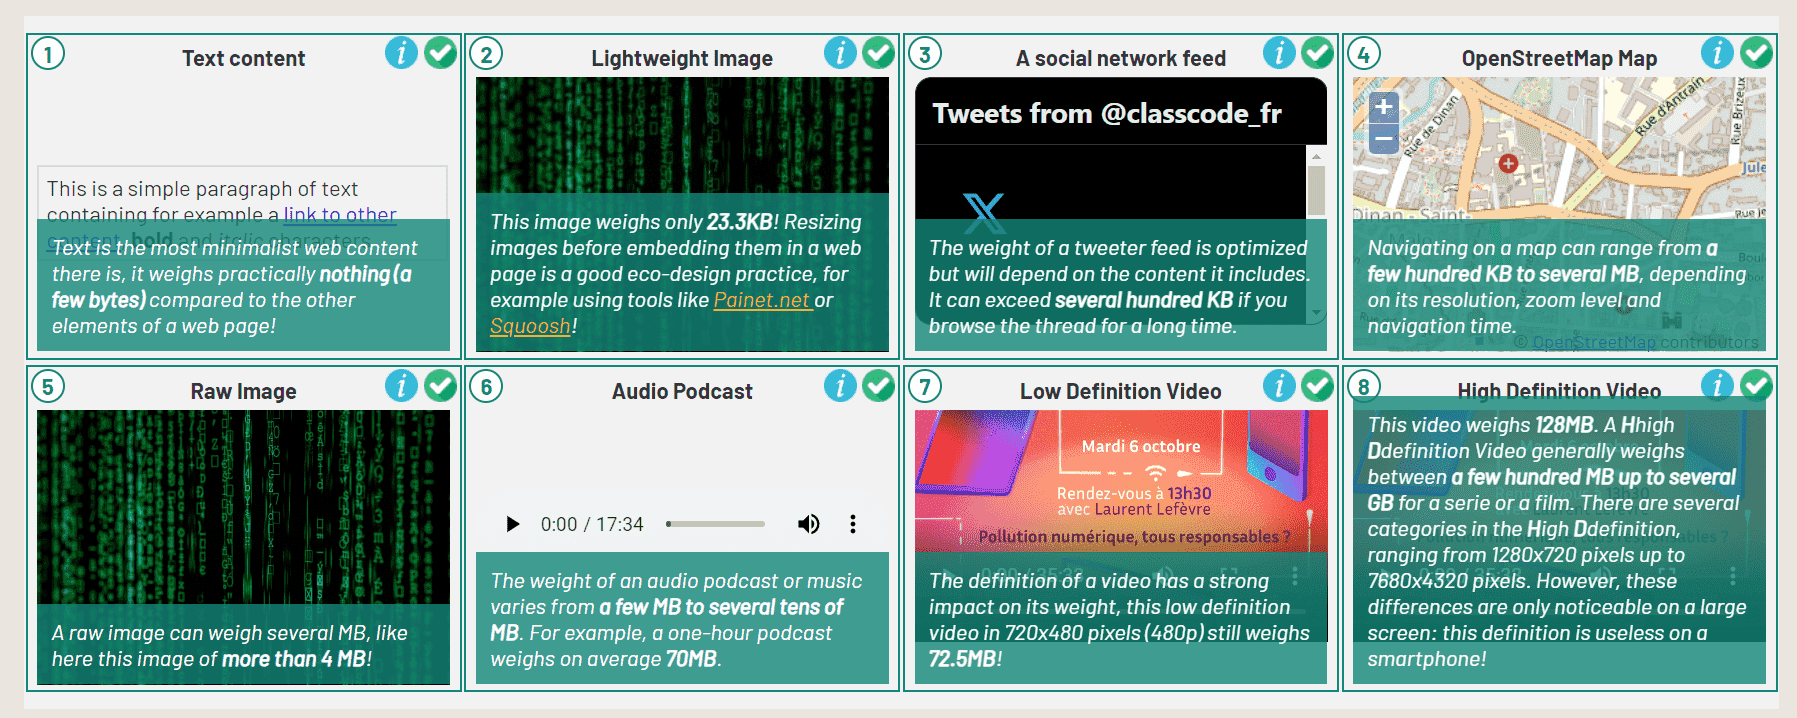
Source: Activity produced by Benjamin Ninassi
Looping back to carbon calculators, for this article, we'll evaluate the carbon footprint of the site trees.org.
I'm starting with Website Carbon Calculator which gives trees.org an F grade since it is dirtier than 88% of all web pages globally. Their grading system is based on the Digital Carbon Rating System developed through the Sustainable Web Design collaboration, as outlined here. This calculator estimates about 1.83 g of CO₂ is produced with every page visit, which is quite significant, especially for a website that promotes sustainability.
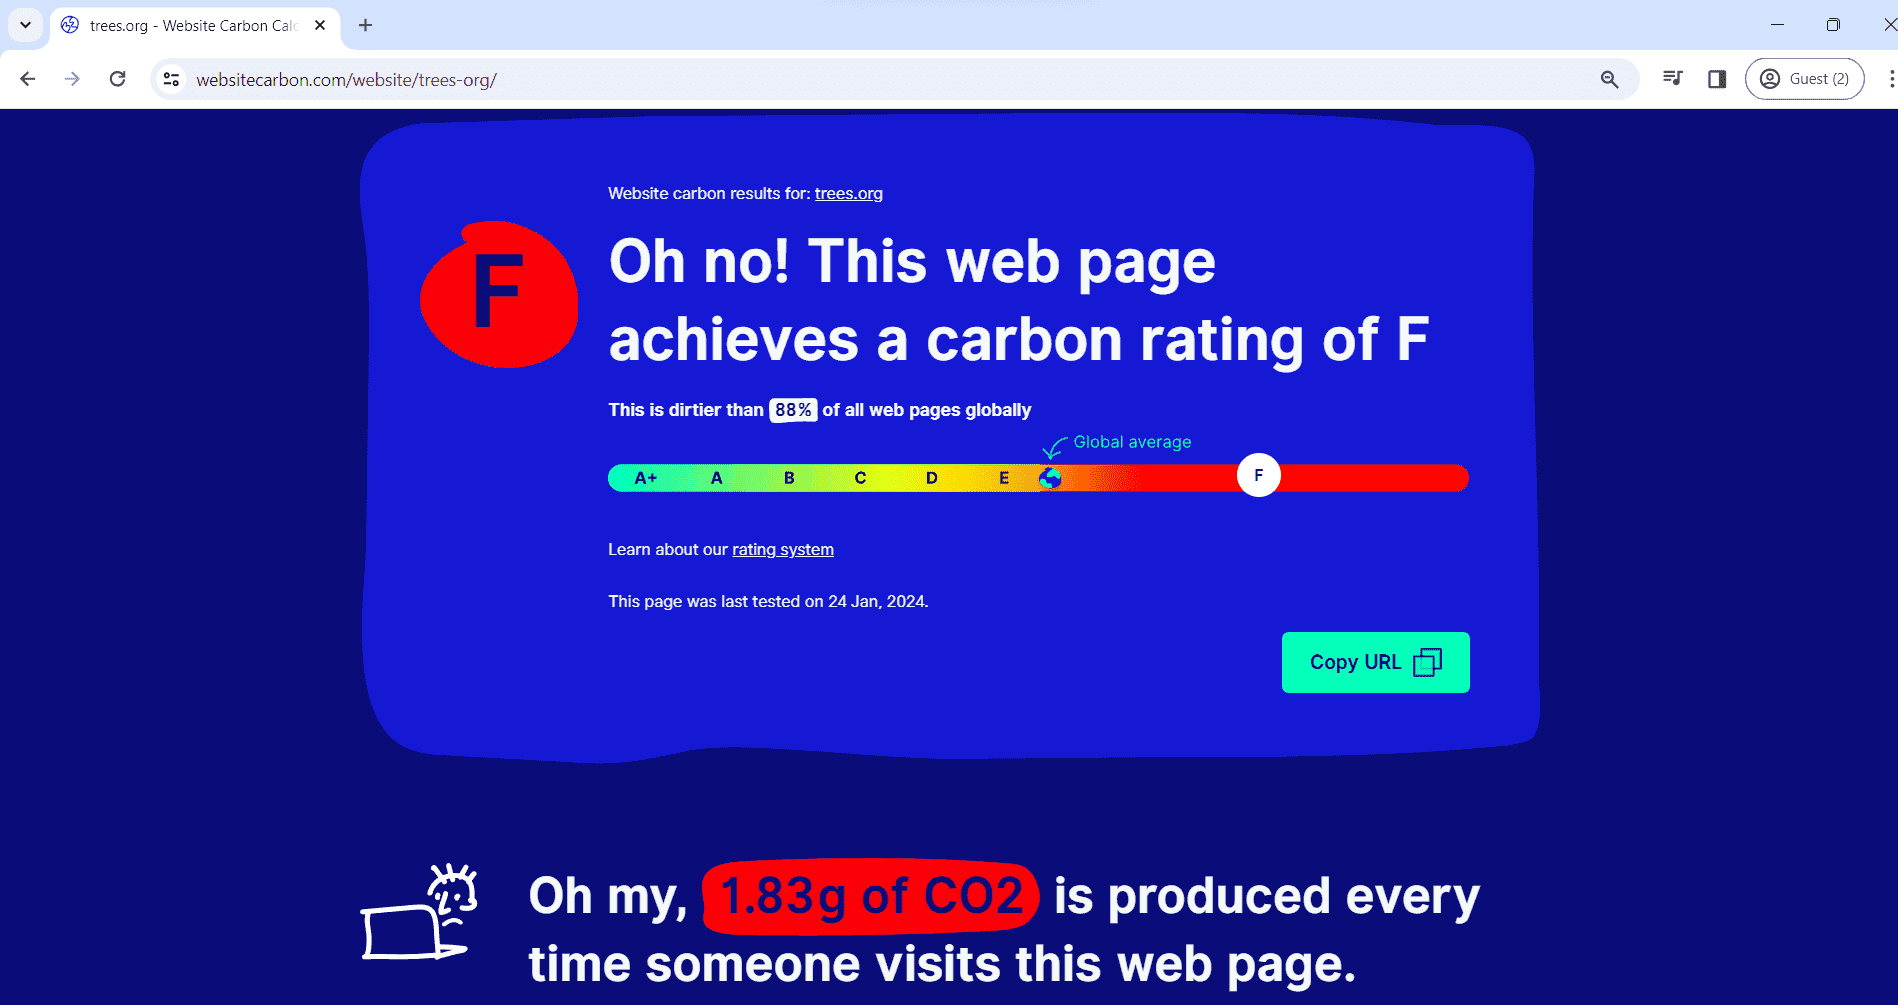
Source: Screenshot courtesy of the author extracted from the websitecarbon test result.
Ecograder also put trees.org on a similar scale rating it a grade E with an estimate of 2.57 g of carbon dioxide produced with every page load.
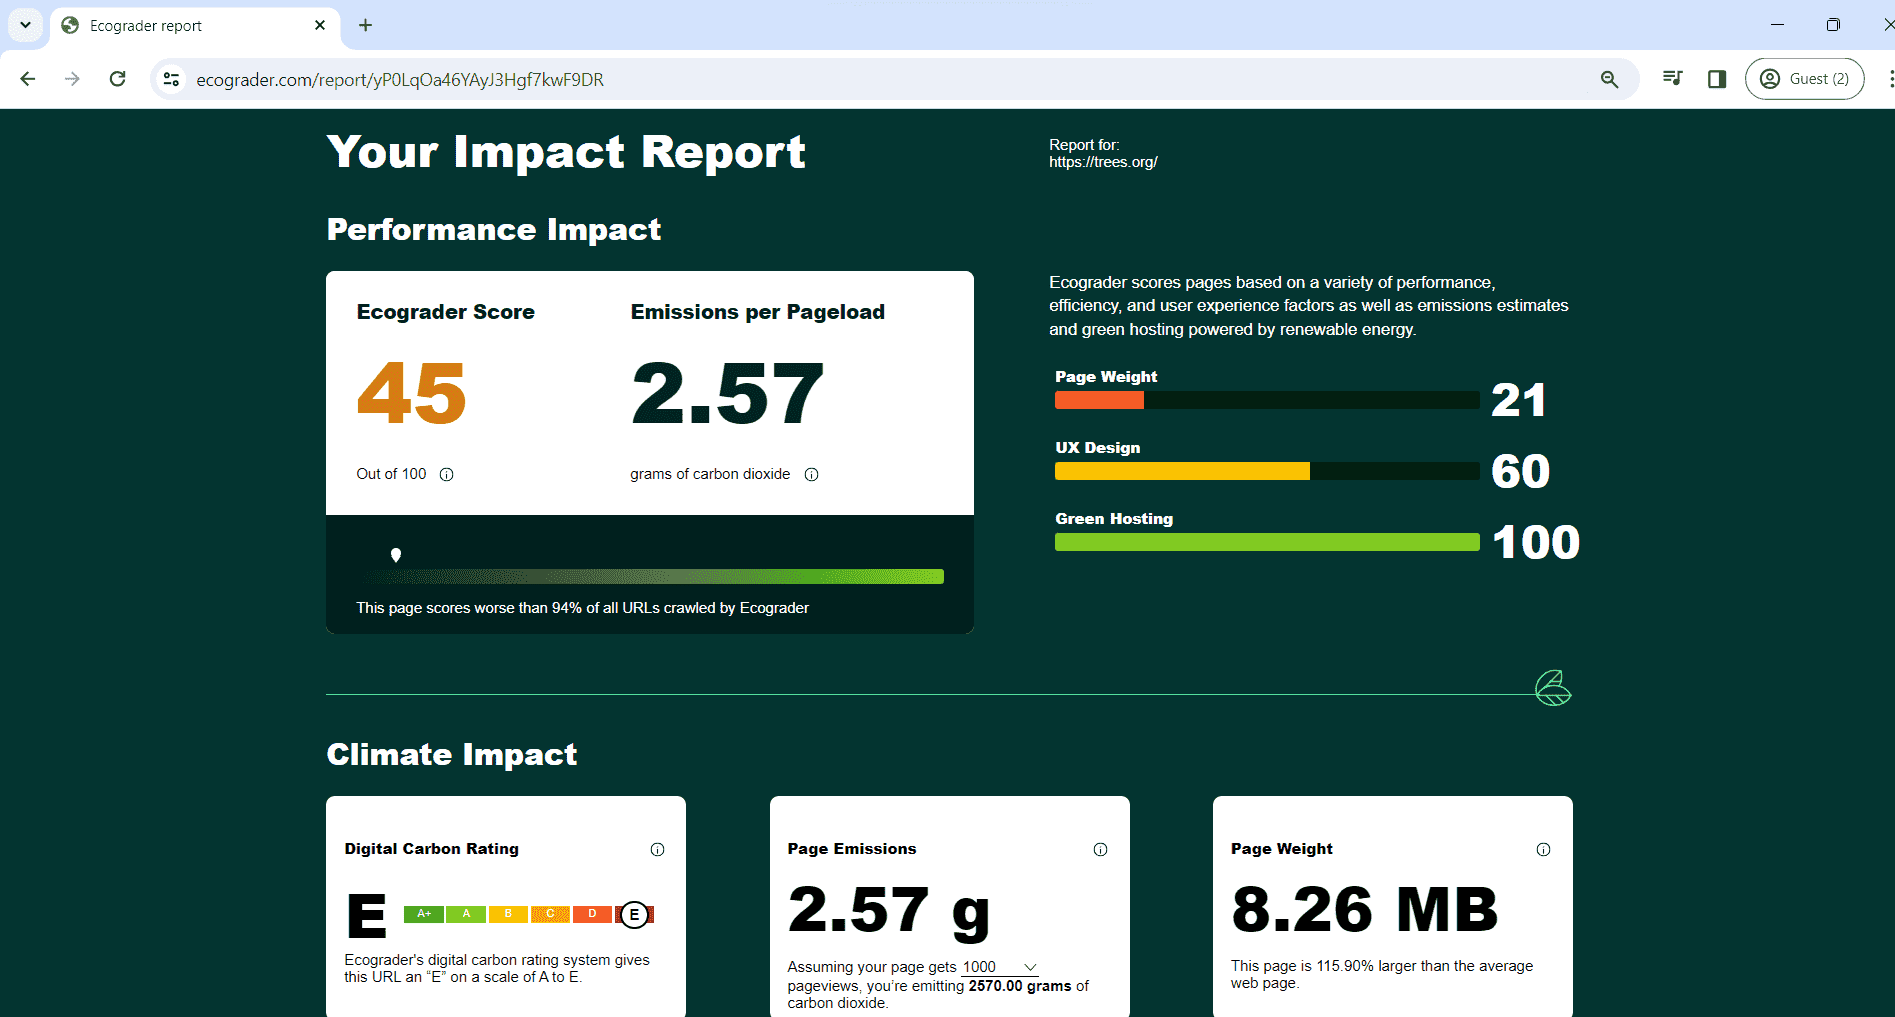
Source: Screenshot courtesy of the author extracted from the ecograder test result.
Scrolling further down in Ecograder, you should a breakdown of what categories produced the associated carbon. As you can see in the screenshot below, scripts seem to be quite large in file size and thus also contribute most towards this high carbon emission score.
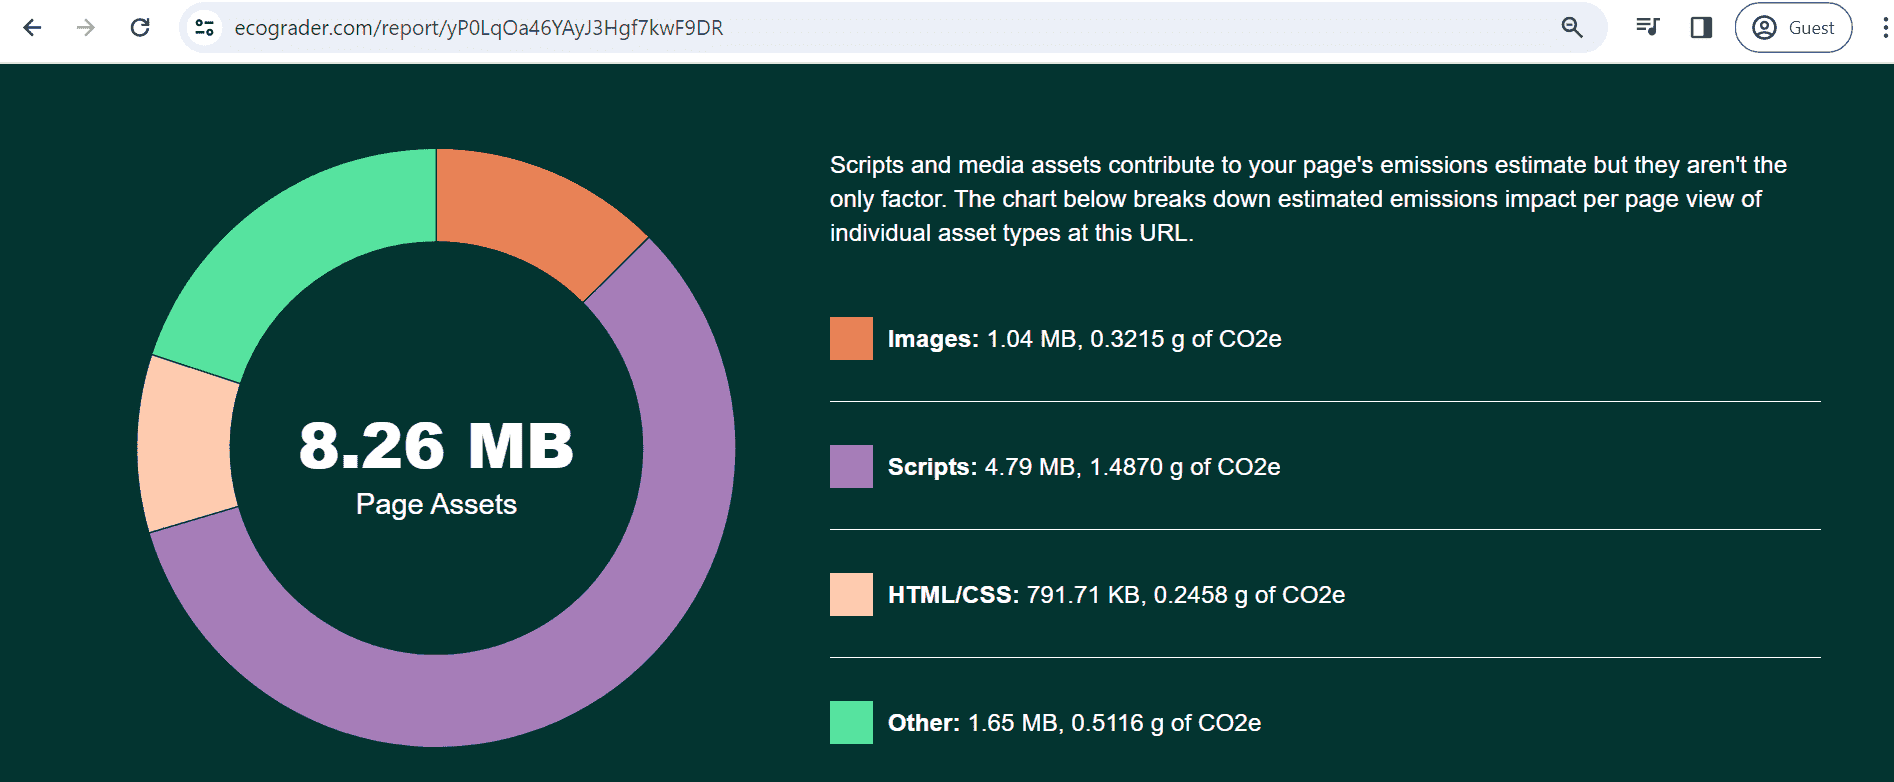
Source: Screenshot courtesy of the author extracted from the ecograder test result.
There's another interesting tool that focuses on images specifically. It's called Image Carbon and running the same site through this tool informs me that about 15% CO₂ could be reduced by optimizing the images. Scrolling down the page shows you the difference between a JPG and the optimized AVIF image file format and the carbon footprint difference between the two.
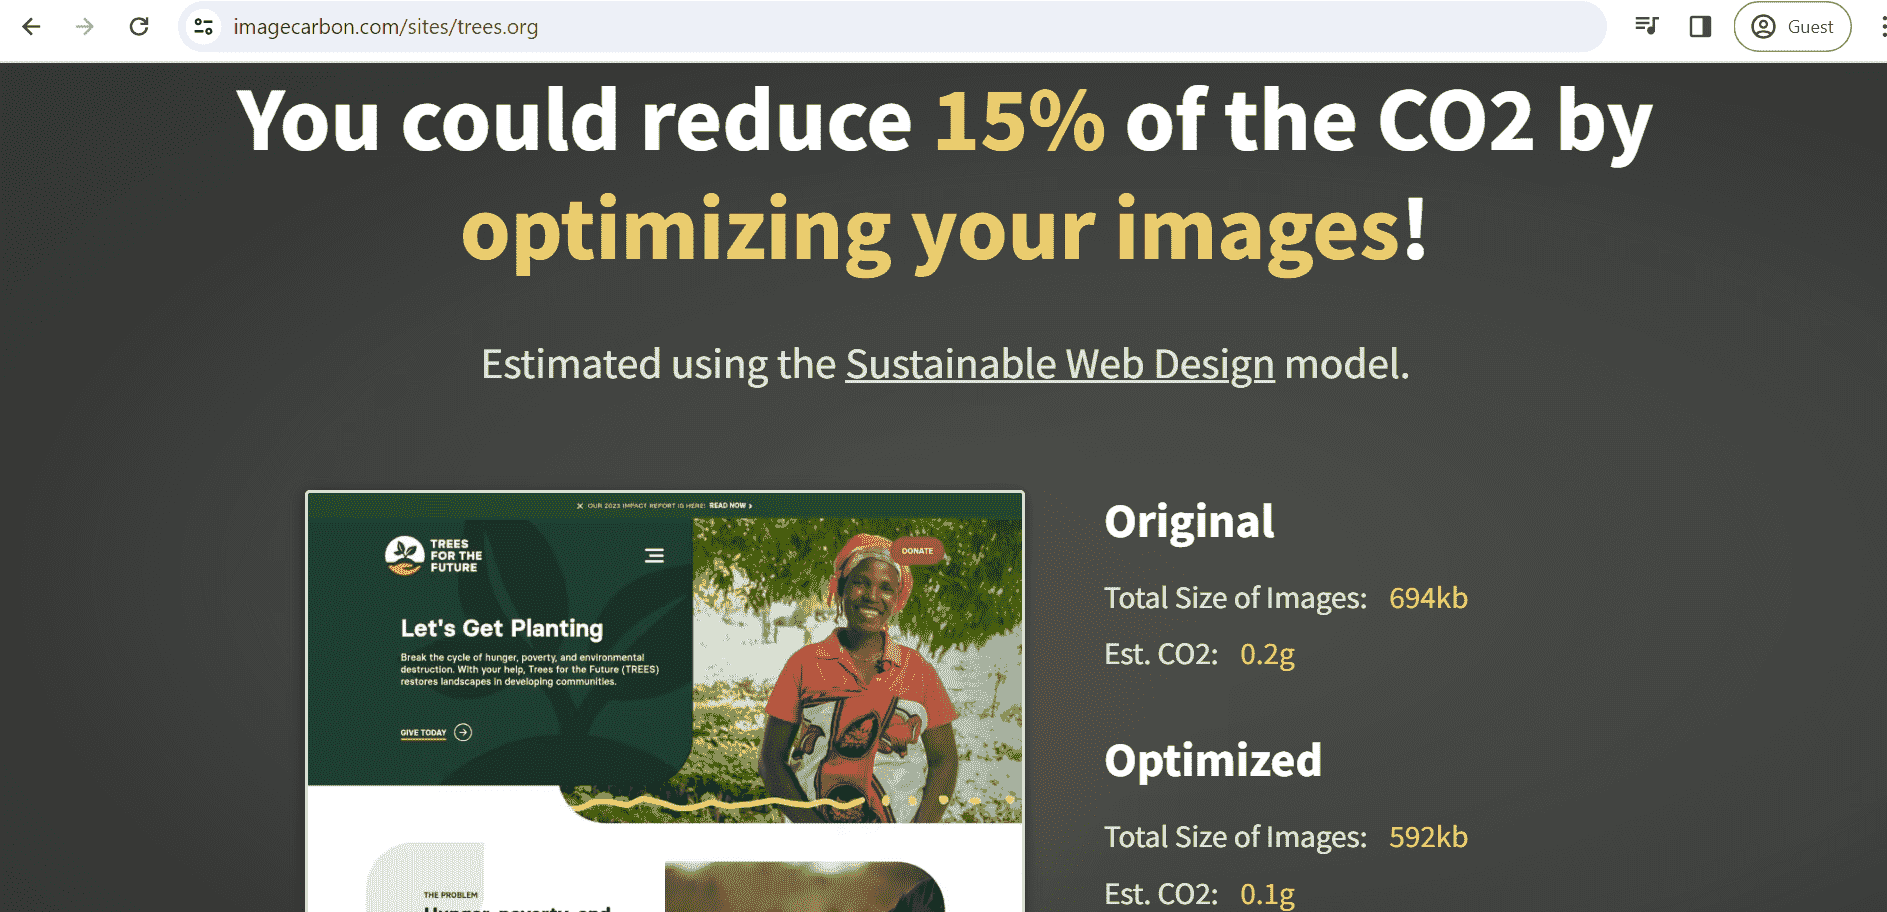
Source: Screenshot courtesy of the author extracted from the imagecarbon test result.
On a side note, the website https://www.muskfoundation.org/ consists of just seven lines of text on a white background, produces a neglible amount of carbon and gets a carbon rating of A+ based on on the test done using websitecarbon.com.
While the above are cloud-based tools, there's also SiteSpeed which can be installed via Docker. Although this tool is primarily used for page speed insight, they have a sustainable web plugin that provides insight into how much CO₂ is emitted.
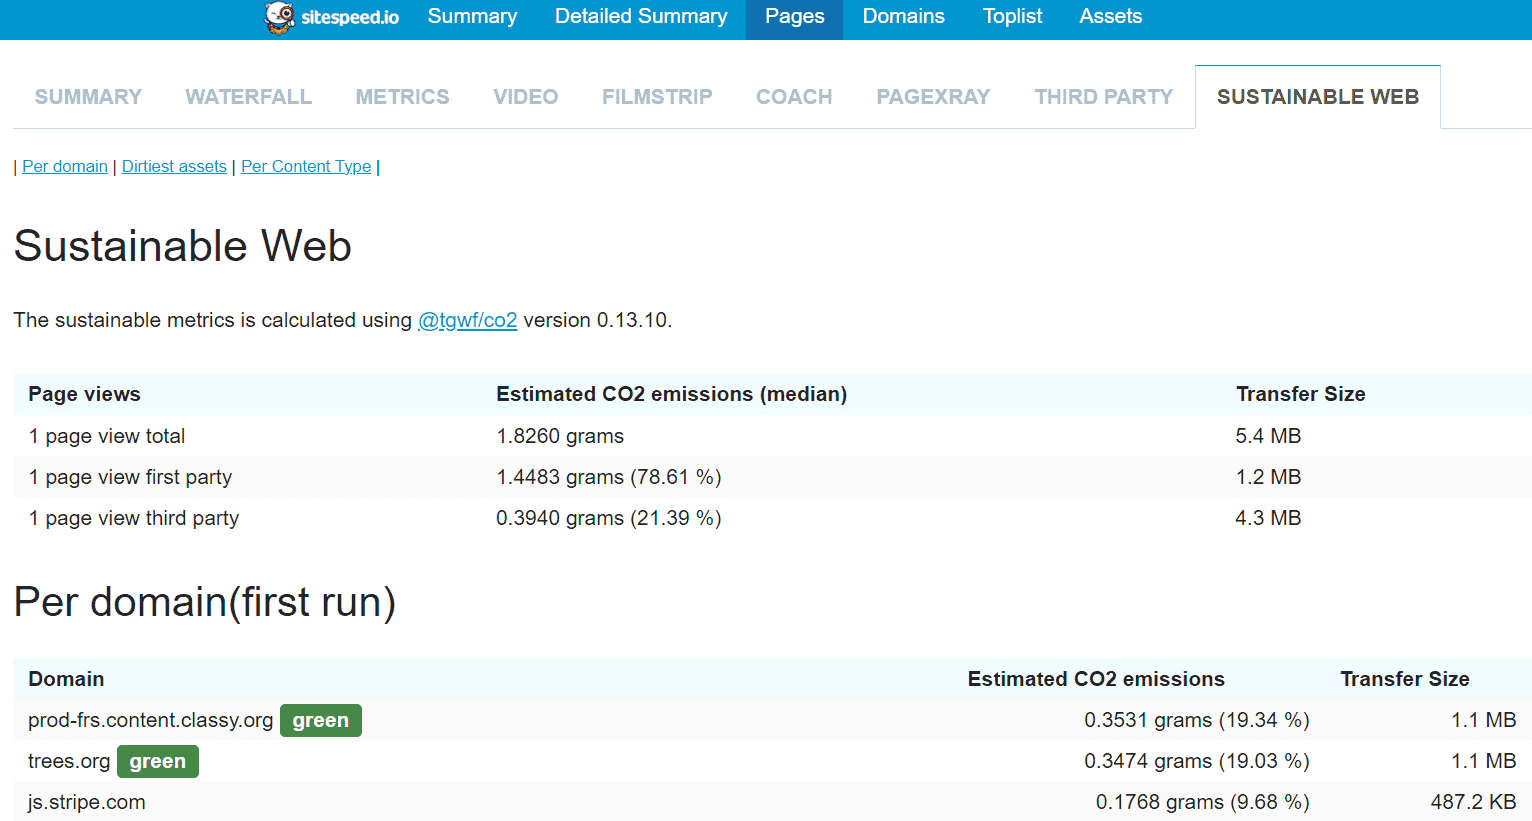
Source: Screenshot courtesy of the author extracted from the sitespeed test result.
For the same site, SiteSpeed estimates the total transfer size to be 5.4 MB and the CO₂ emissions to be 1.8260 grams. The report looks something like the screenshot above. Further down this page, SiteSpeed also provides a breakdown per domain, per content type, and a list of dirty assets.
A similar website is aremythirdpartiesgreen.com which tells you very quickly which third-party resources your website loads are hosted on green servers and which aren't.
Under the hood, most of these tools use a JavaScript library called CO2.js developed by The Green Web Foundation which abstracts away the complex calculations and provides you with an interface to plug into when building public or internal tools that estimate the carbon emissions of software.
The Green Web Foundation has also built a tool that allows you to check if a website is hosted by a green provider.
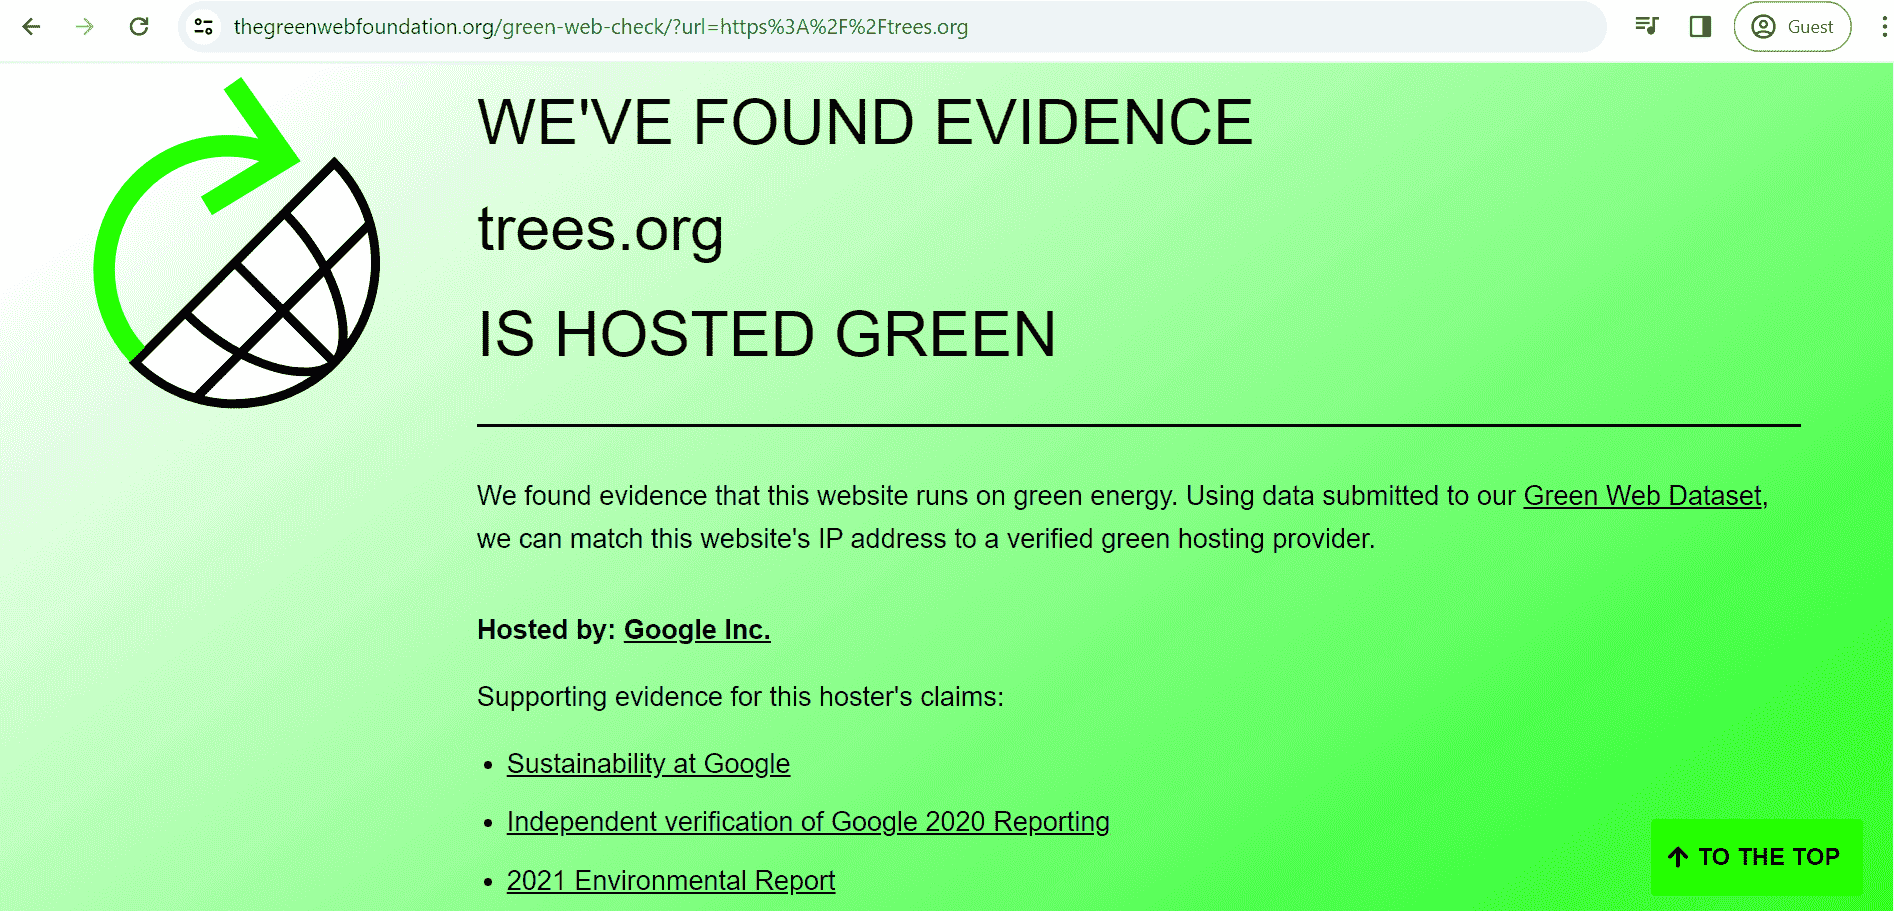
Source: Screenshot courtesy of the author extracted from the thegreenwebfoundation test result.
Checking trees.org on this tool confirms that they're hosted by Google which are green providers. Google has provided evidence to support their claim and this tool allows us to read and verify all of that on the same page, which is super handy.
Chapter 3: Caveats and Complexities
Although on the surface calculating carbon emissions seems pretty straightforward, it actually has a lot of complexities involved.
For starters, even comparing the tools in the exercise above, there are some discrepancies in the carbon emission estimates as well as the transfer size of the contents. Such discrepancies in testing and grading technologies are also documented here which performs a similar exercise on weather.com and details how each tool calculates the emissions under the hood and what their flawed assumptions might be. This article goes into detail about how various agencies are ending up with different estimates while calculating the CO₂ emissions produced as a result of watching 30 minutes of Netflix content. Netflix has stated that the carbon footprint of streaming one hour of video is approx. 55 g CO₂e, in their 2022 sustainability report.
Most of the carbon calculators estimate based on page weight but in reality, page weight may not be the most suitable metric. This article outlines various arguments supporting this. However, some notable highlights are that carbon emissions are largely caused by the production (also known as embodied carbon emissions) and the operations (in the form of electricity consumption) of end-user devices, data centres, and infrastructure. Netflix backs this by saying that approx. 89% of emissions in their end-to-end value chain come from device manufacturers and not from streaming the video content itself. Dell and HP also state that a majority of the carbon footprint of their servers is generated in the manufacturing and use phase. This also means that frequently upgrading your devices contributes more toward environmental damage than the emissions by consuming content.
Sending more or less data doesn't affect the electricity consumption of the network devices, but the type of data might certainly affect it. Network devices once turned on, consume a constant amount of energy irrespective of their utilization and are fixed to around 14% of the total energy usage. Sending an image over the wire might get flagged by the carbon calculators but if the page requires some complex database queries and server-side processing, it might not be reported. In reality, processing this request on the server might require more energy on the server as opposed to serving a large image.
Carbon calculators, depending on the calculation model being used, tend to make certain assumptions about the system boundaries, the energy consumption of data and even the carbon intensity.
Some calculators make different assumptions on the system boundaries, or in other words, which parts of the system are being studied. This filtration omits the energy consumption that should've otherwise been reported. As outlined in this article, if we want to understand the bigger picture of total emissions associated with a website, then we need a wide system boundary.
Consuming web content on different types of devices requires varied levels of energy. To add to the mix, one could've consumed your content when it was unplugged but could've charged their device when the carbon intensity for their grid at that time was the lowest. Software updates constantly work to make the device's energy consumption better, and different brand manufacturers might have different energy ratings for their devices. All of this makes calculating the energy consumption aspect incredibly complex.
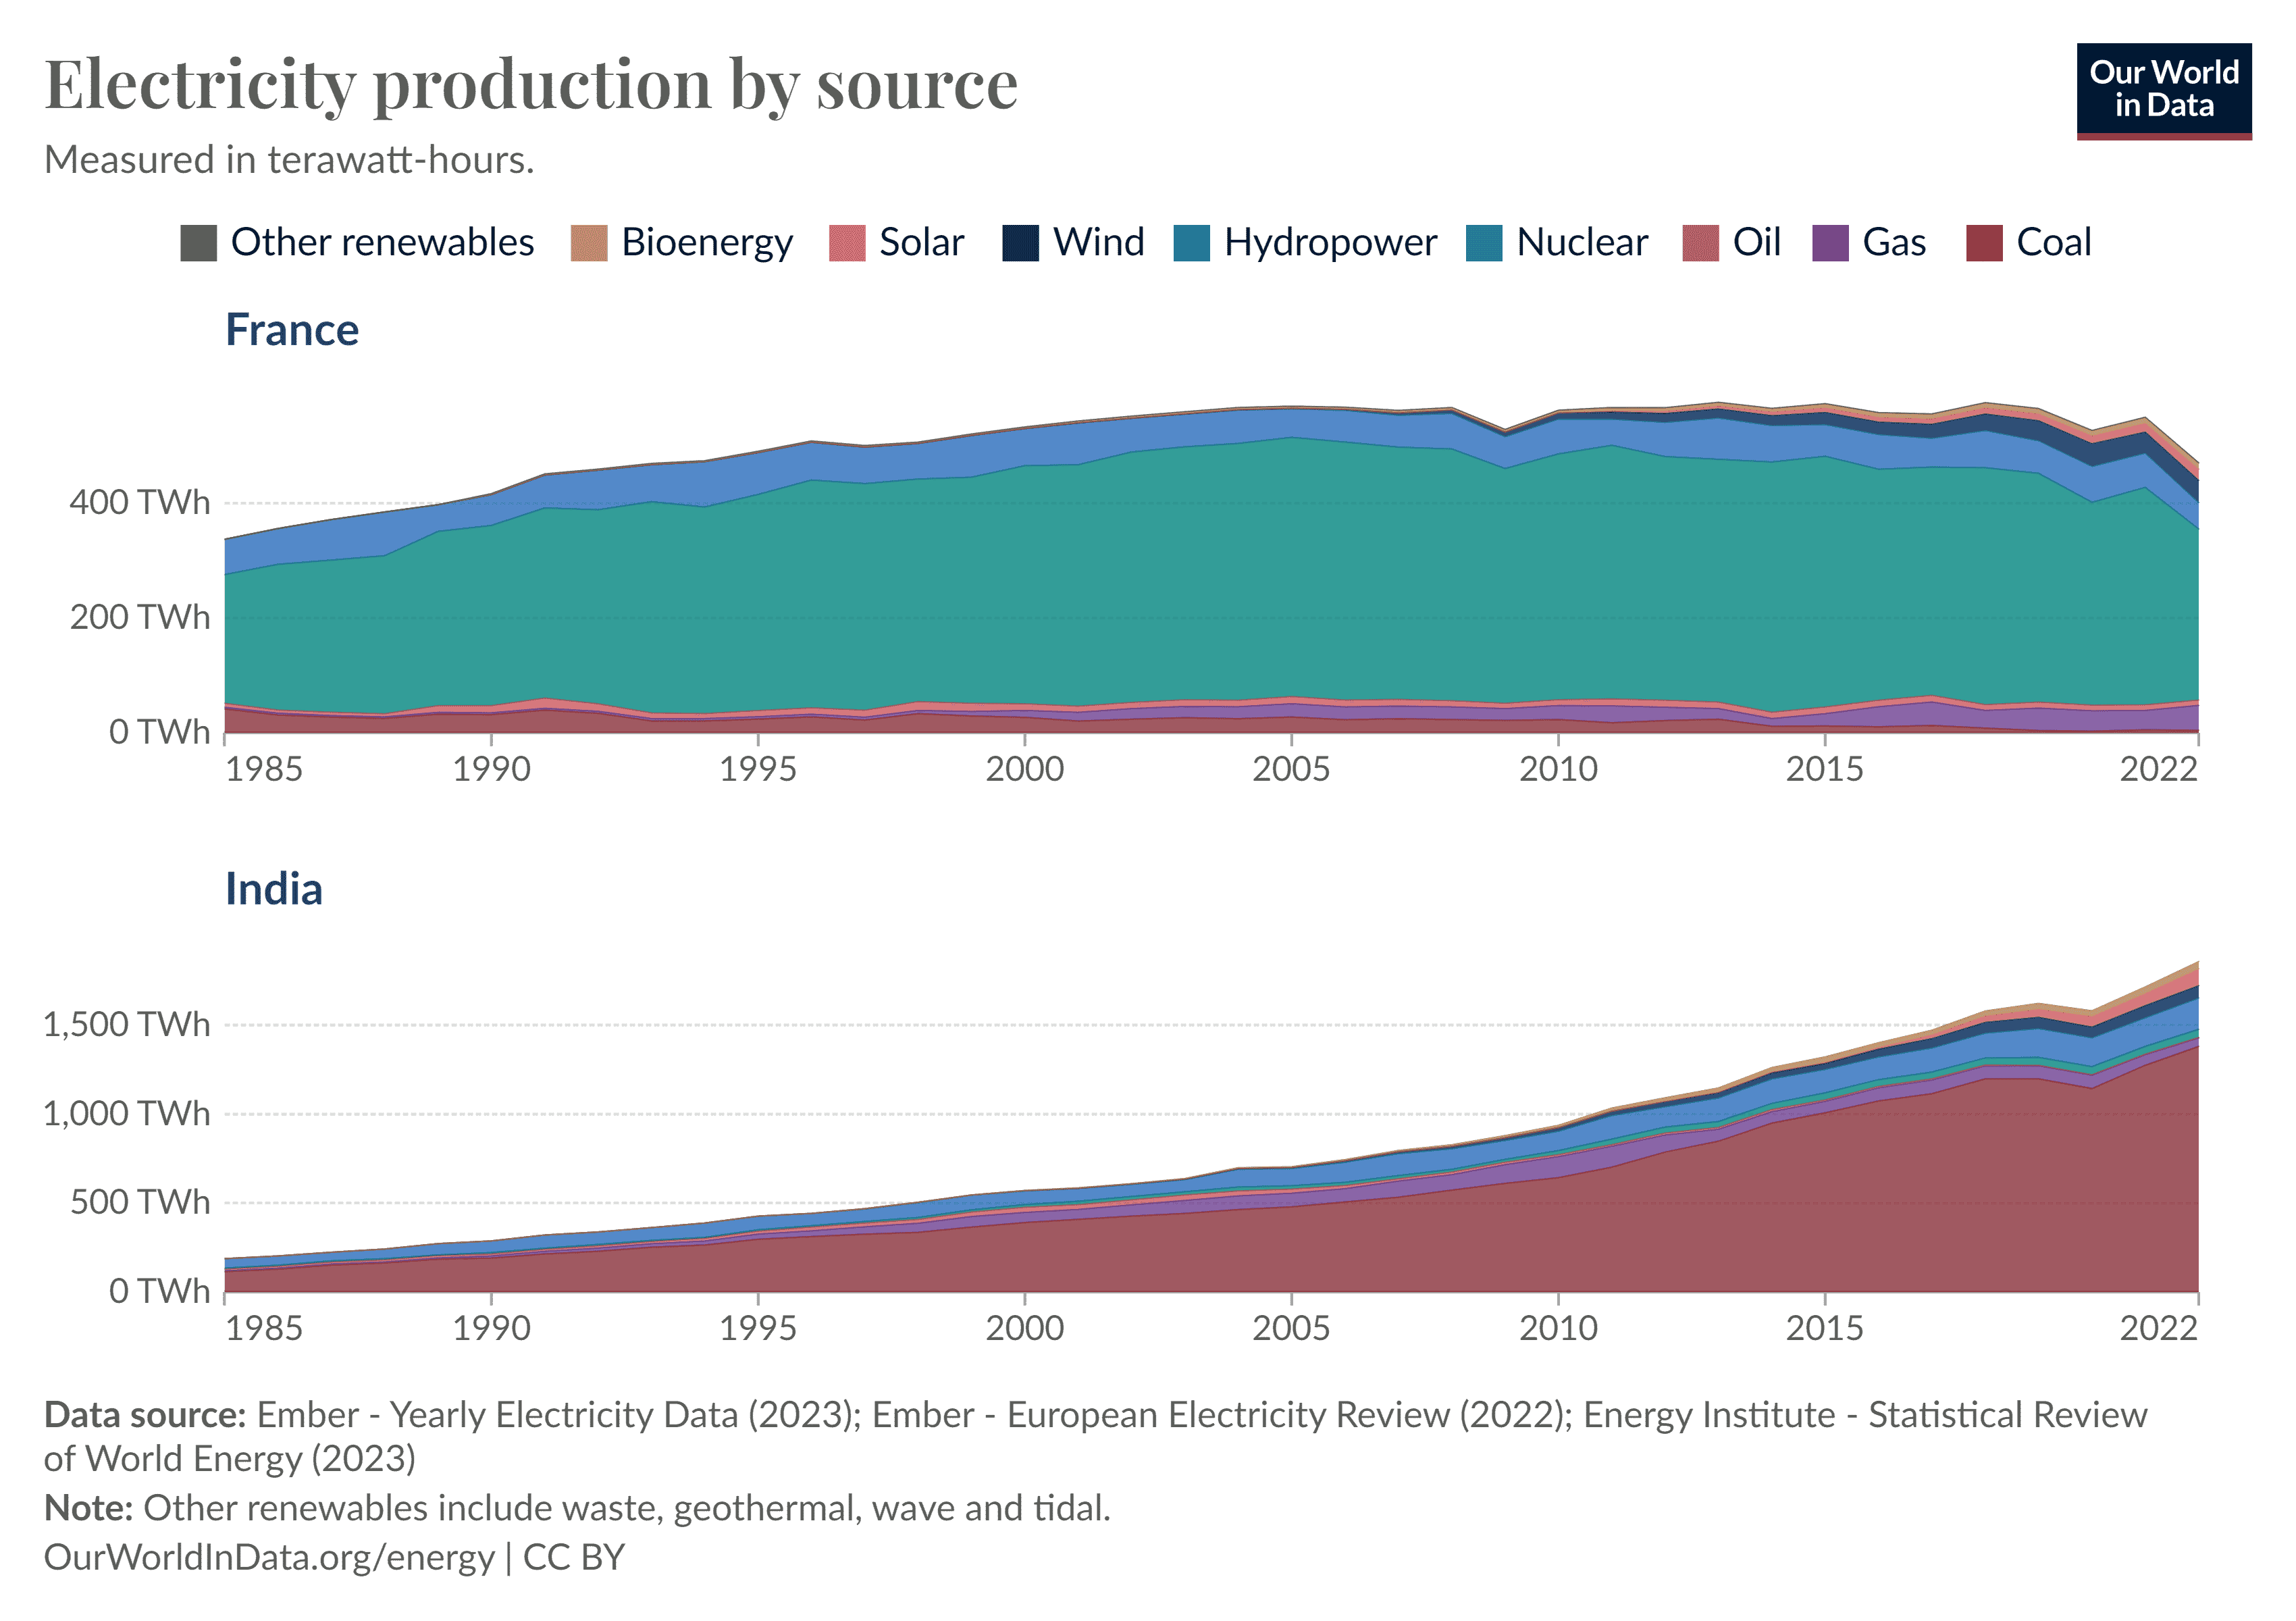
The carbon intensity of electricity production also varies across the world. Countries that get a large share of their electricity from low-carbon sources will have a lower carbon intensity.
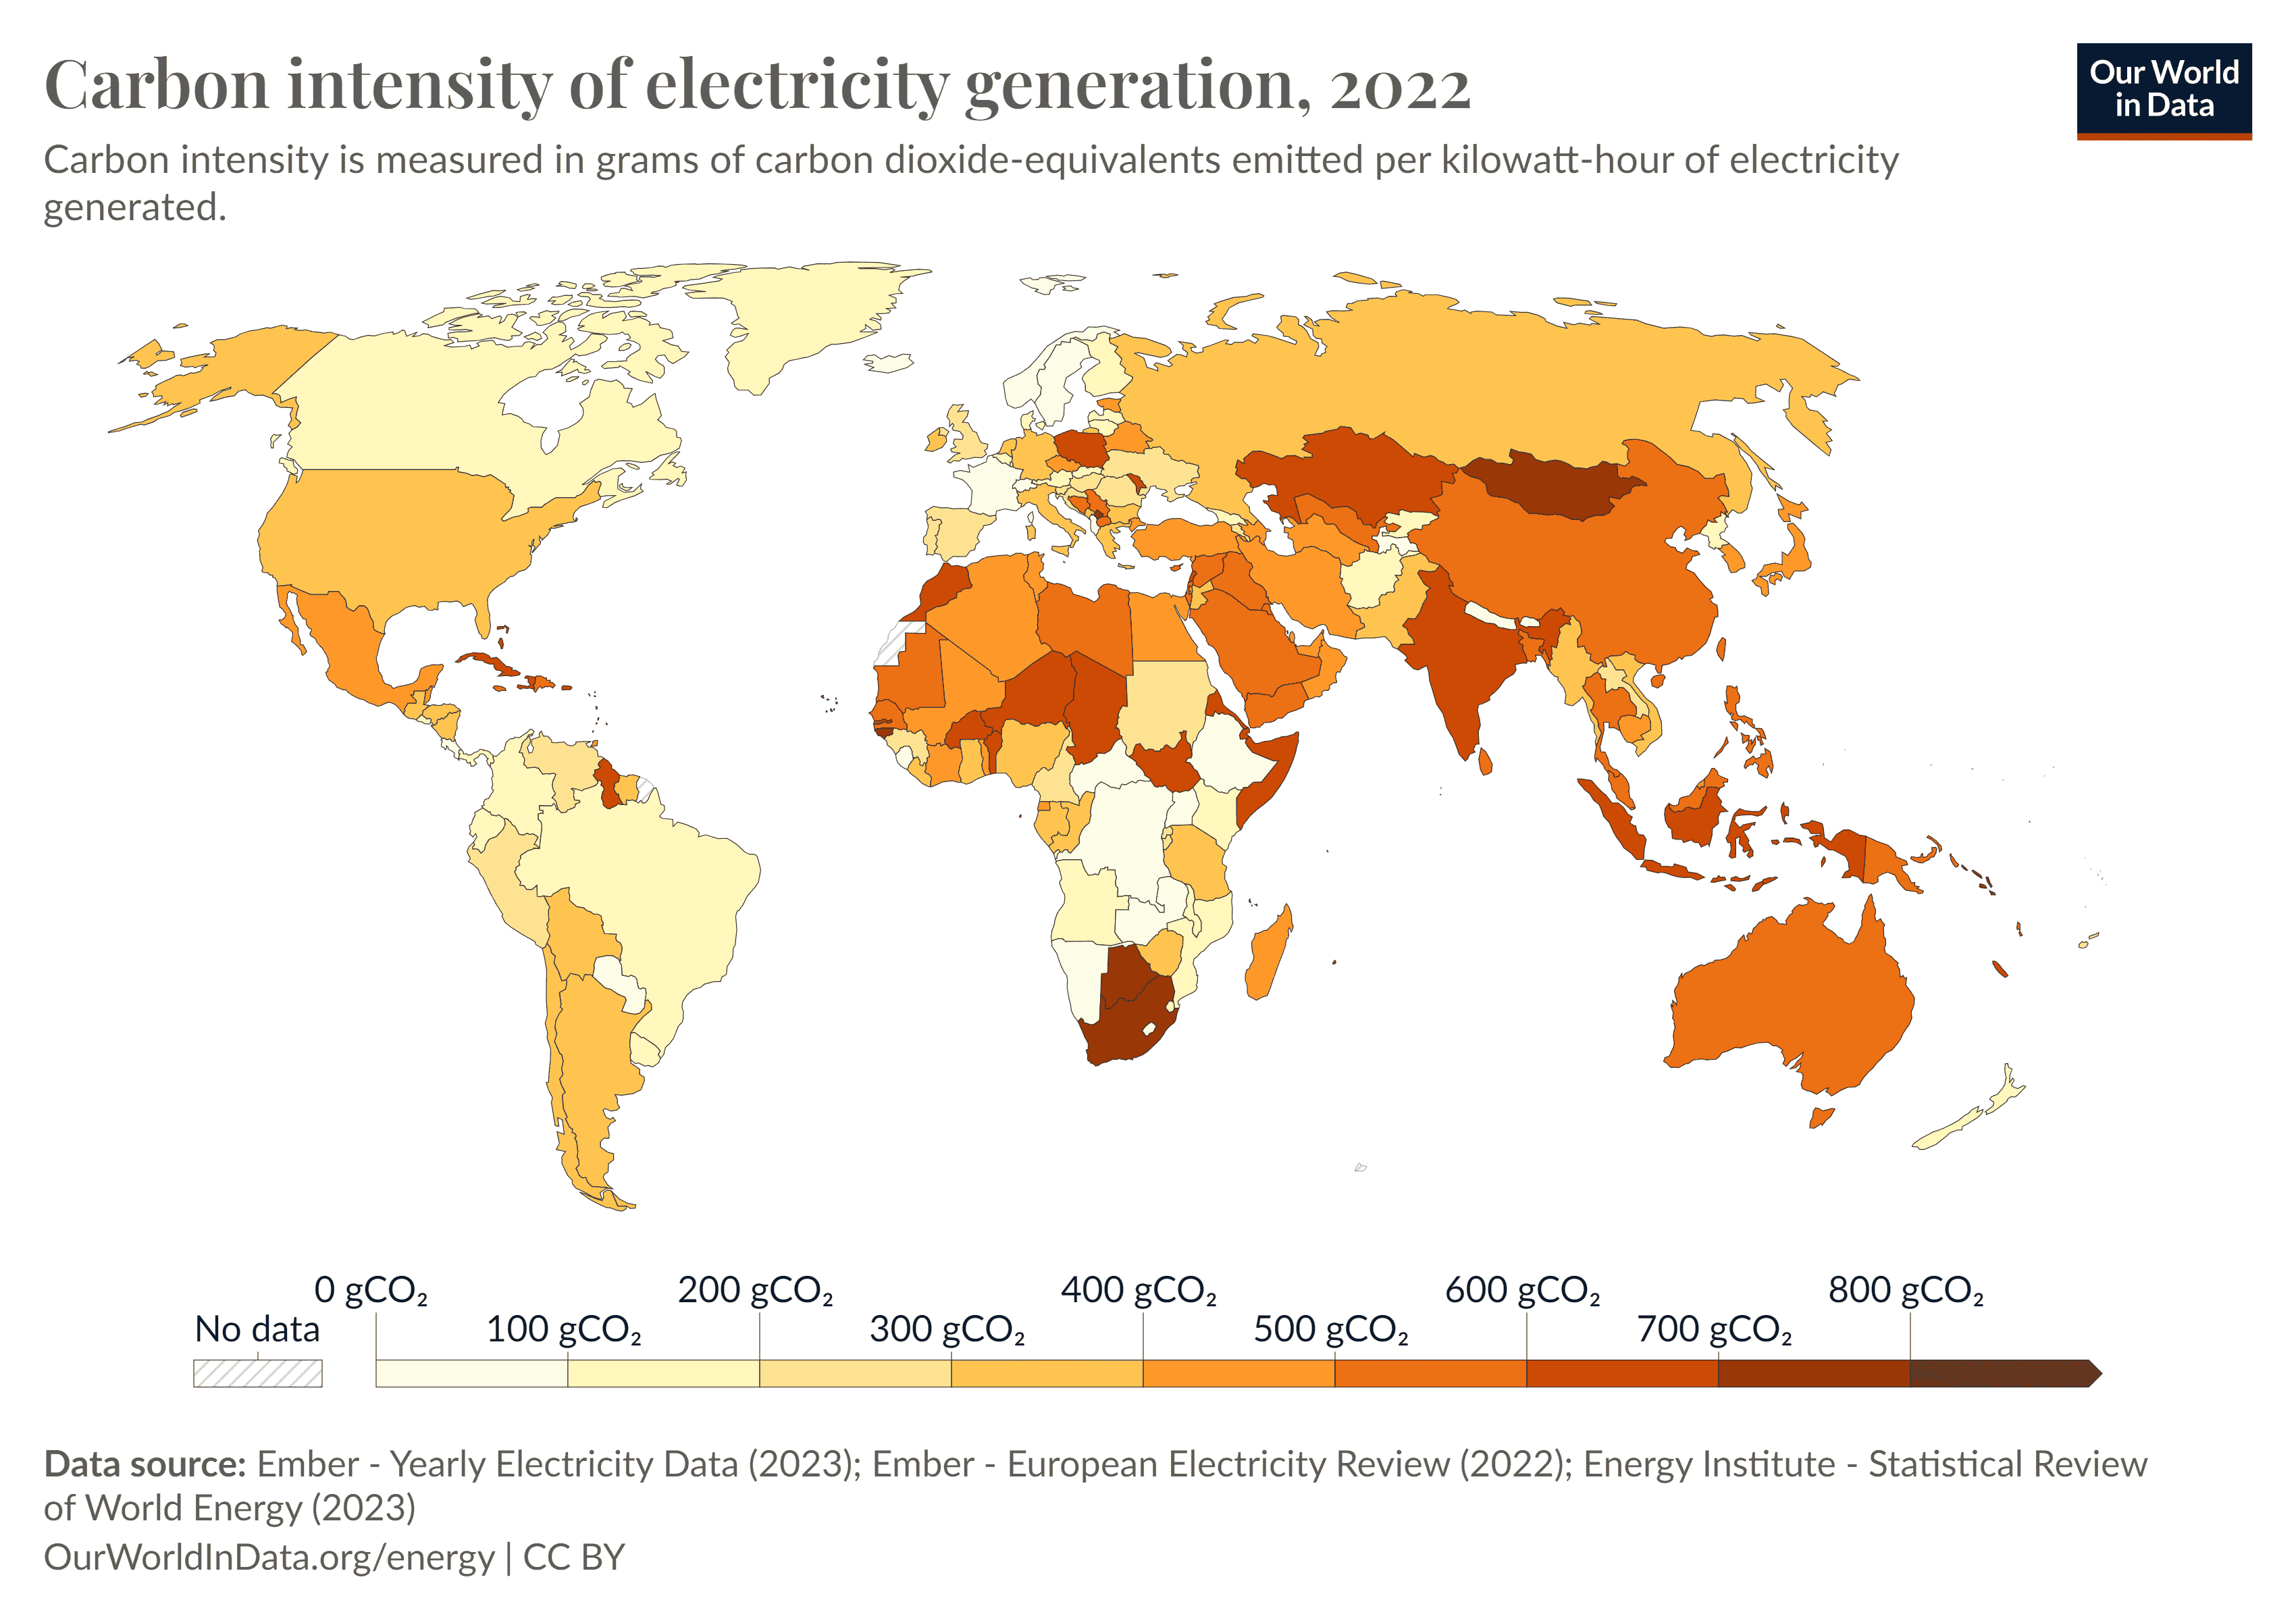
Source: https://ourworldindata.org/grapher/carbon-intensity-electricity
And because of this, the calculation model shouldn't assume a constant value for carbon intensity. A user accessing a website from India will effectively produce more carbon emissions in comparison with a user accessing the same website from France because France sources most of its electricity from low-carbon sources.
Tom Greenwood, in this article, also presents an interesting take on a potential conflict of interest. He states that many studies in this area are funded by tech companies or conducted by research teams at big tech companies, and while there isn't any explicitly stated conflict of interest, there is a natural incentive for these companies to downplay energy consumption. On the other side of the spectrum, there's speculation that the tools reporting very high emissions may have been funded or influenced by industries negatively impacted by digital transformation.
Chapter 4: Big picture and motives
Carbon budgets and global policies
A carbon budget refers to the total amount of carbon dioxide (CO₂) emissions that can be released into the atmosphere while still keeping global temperatures within a certain target range to mitigate climate change.
The concept of a carbon budget is based on the idea that there is a finite amount of carbon that can be emitted into the atmosphere before the global average temperature exceeds certain thresholds, leading to potentially catastrophic climate impacts. Scientists calculate carbon budgets based on various factors such as desired temperature targets, the amount of carbon already emitted, and the sensitivity of the climate system to greenhouse gas emissions.
Carbon budgets are often used in climate policy discussions and agreements to guide efforts to reduce emissions and limit global warming. They provide a framework for allocating emissions reductions among different countries, sectors, and industries, and help inform decision-making on climate mitigation strategies. In 2015, 196 countries and the European Union signed the Paris Agreement which is a legally binding international treaty aimed at addressing climate change.
Efforts from big companies
The big players in technology have already jumped on the sustainability bandwagon for a few years now.
Microsoft has been carbon neutral since 2012 and announced that by 2030 it will be carbon negative, and by 2050 it will remove from the environment all the carbon the company has emitted either directly or by electrical consumption since it was founded in 1975.
In 2022, 90% of the electricity consumed by Amazon was attributable to renewable energy sources. AWS is on a path to powering its operations with 100% renewable energy by 2025, as part of its commitment to reaching net-zero carbon emissions by 2040.
Source: https://sustainability.aboutamazon.com/carbon-reduction-aws.pdf
Google, on the other hand, has been carbon neutral since 2007 and as of 2020, has eliminated their entire operational emissions since they were founded by purchasing high-quality carbon offsets making their net carbon footprint zero. By 2030 Google is aiming to run its business on carbon-free energy everywhere, at all times.
Source: https://www.gstatic.com/gumdrop/sustainability/google-2023-environmental-report.pdf
Asim Hussain, an expert in sustainable software, noted that the predominant change he observes stems from regulatory measures or the threat of regulation. Companies will need to submit to the regulations and carbon budgets and being able to demonstrate that they're committed to sustainability will ultimately yield greater advantages for them in the long term. On a similar note, being accredited with certifications like ISO14001 or BCorp can positively help their branding.
Carbon neutral, net zero or carbon negative?
There are three additional terms thrown around which might sound the same but it means something different. Let's take a look.
- Carbon neutral: Achieving carbon neutrality means that an equivalent amount of CO₂ removal or offsetting balances the net emissions of carbon dioxide (CO₂) into the atmosphere.
- Carbon negative: This means removing more carbon dioxide from the atmosphere than is emitted. This is typically achieved through measures like reforestation, afforestation, soil carbon sequestration, or advanced carbon capture and storage technologies. By actively removing more CO₂ than is produced, carbon-negative activities have a net benefit in reducing atmospheric CO₂ levels.
- Net zero: This refers to the balance between the amount of greenhouse gases, not just CO₂, emitted and the amount removed from the atmosphere.
Scopes
If you read sustainability reports, you'll come across a term called scopes. But what are they?
The term scopes comes from the Greenhouse Gas Protocol, the world's most widely used greenhouse gas accounting standard. They classify carbon emissions into three scopes as follows:
- Scope 1 emissions are the direct emissions that an organisation creates from activities like
- Scope 2 emissions are indirect emissions produced from electricity or heat that the business uses.
- Scope 3 emissions are indirect emissions that come from all other indirect upstream and downstream sources, for instance, emissions generated from manufacturing the products that the organisation buys.
When visualised in terms of scopes, emission sources for an organisation can be extensive and scopes enable these organisations to understand their full value chain emissions and focus their efforts on the greatest reduction opportunities. Usually, one might find that Scope 3 emissions tend to be higher than Scope 1 and 2 combined.
Carbon credits
It's important to understand that there is a difference between carbon credits and carbon offset. Carbon credit is reducing the CO₂e released into the atmosphere while carbon offset is the removal of CO₂e from the atmosphere.
When governments put a cap on greenhouse gas emissions, companies are forced to either reduce their emissions, purchase carbon credits from other companies that can reduce their emissions below the mandated level to negate the unavoidable emissions or pay hefty fines. Each credit is equivalent to one tonne of CO₂e emissions. Although carbon credits are just a unit of measurement to cap the permitted emissions, they effectively help in reducing emissions because companies are compelled to make efforts to reduce their emissions. An example could be a company sourcing their electricity needs from a clean energy source instead of a dirty one.
On the other hand, some companies go above and beyond to eliminate even past carbon emissions by purchasing carbon offsets. Offsets are voluntary and are available to both companies and individuals. An example could be a company funding renewable projects.
Carbon credits and offsets are not a fool-proof solution, though.
Problems with carbon credits and offsets
Purchasing carbon credits may result in emissions being moved from the industries that pollute to the industries that try to reduce. Just because a fossil fuel company is purchasing carbon credits to offset its emissions, it doesn't mean that it's not emitting carbon and causing harm. This system could also drive the demand for carbon credits, not decarbonization. Because instead of making the efforts to research and invest in actions to reduce their carbon emissions, the polluters would only need to worry about purchasing carbon credits so they appear carbon neutral on paper.
The other issue is the integrity of these carbon credits. Crediting agencies are handing out carbon credits for projects that don't 100% reduce emissions. A study found that 90% of Verra's rainforest carbon credits do not represent real emission reductions. This implies that while on paper large corporations are purchasing these carbon credits to claim to be carbon neutral, some of these credits could be meaningless due to low integrity, thus, not resulting in a positive difference in the carbon emissions.
The rise of the internet
Even though only 60% of the world's population was online in 2020, that's still a massive 4.70 billion users! It now provides an endless list of services including communication, education, entertainment and a lot more.
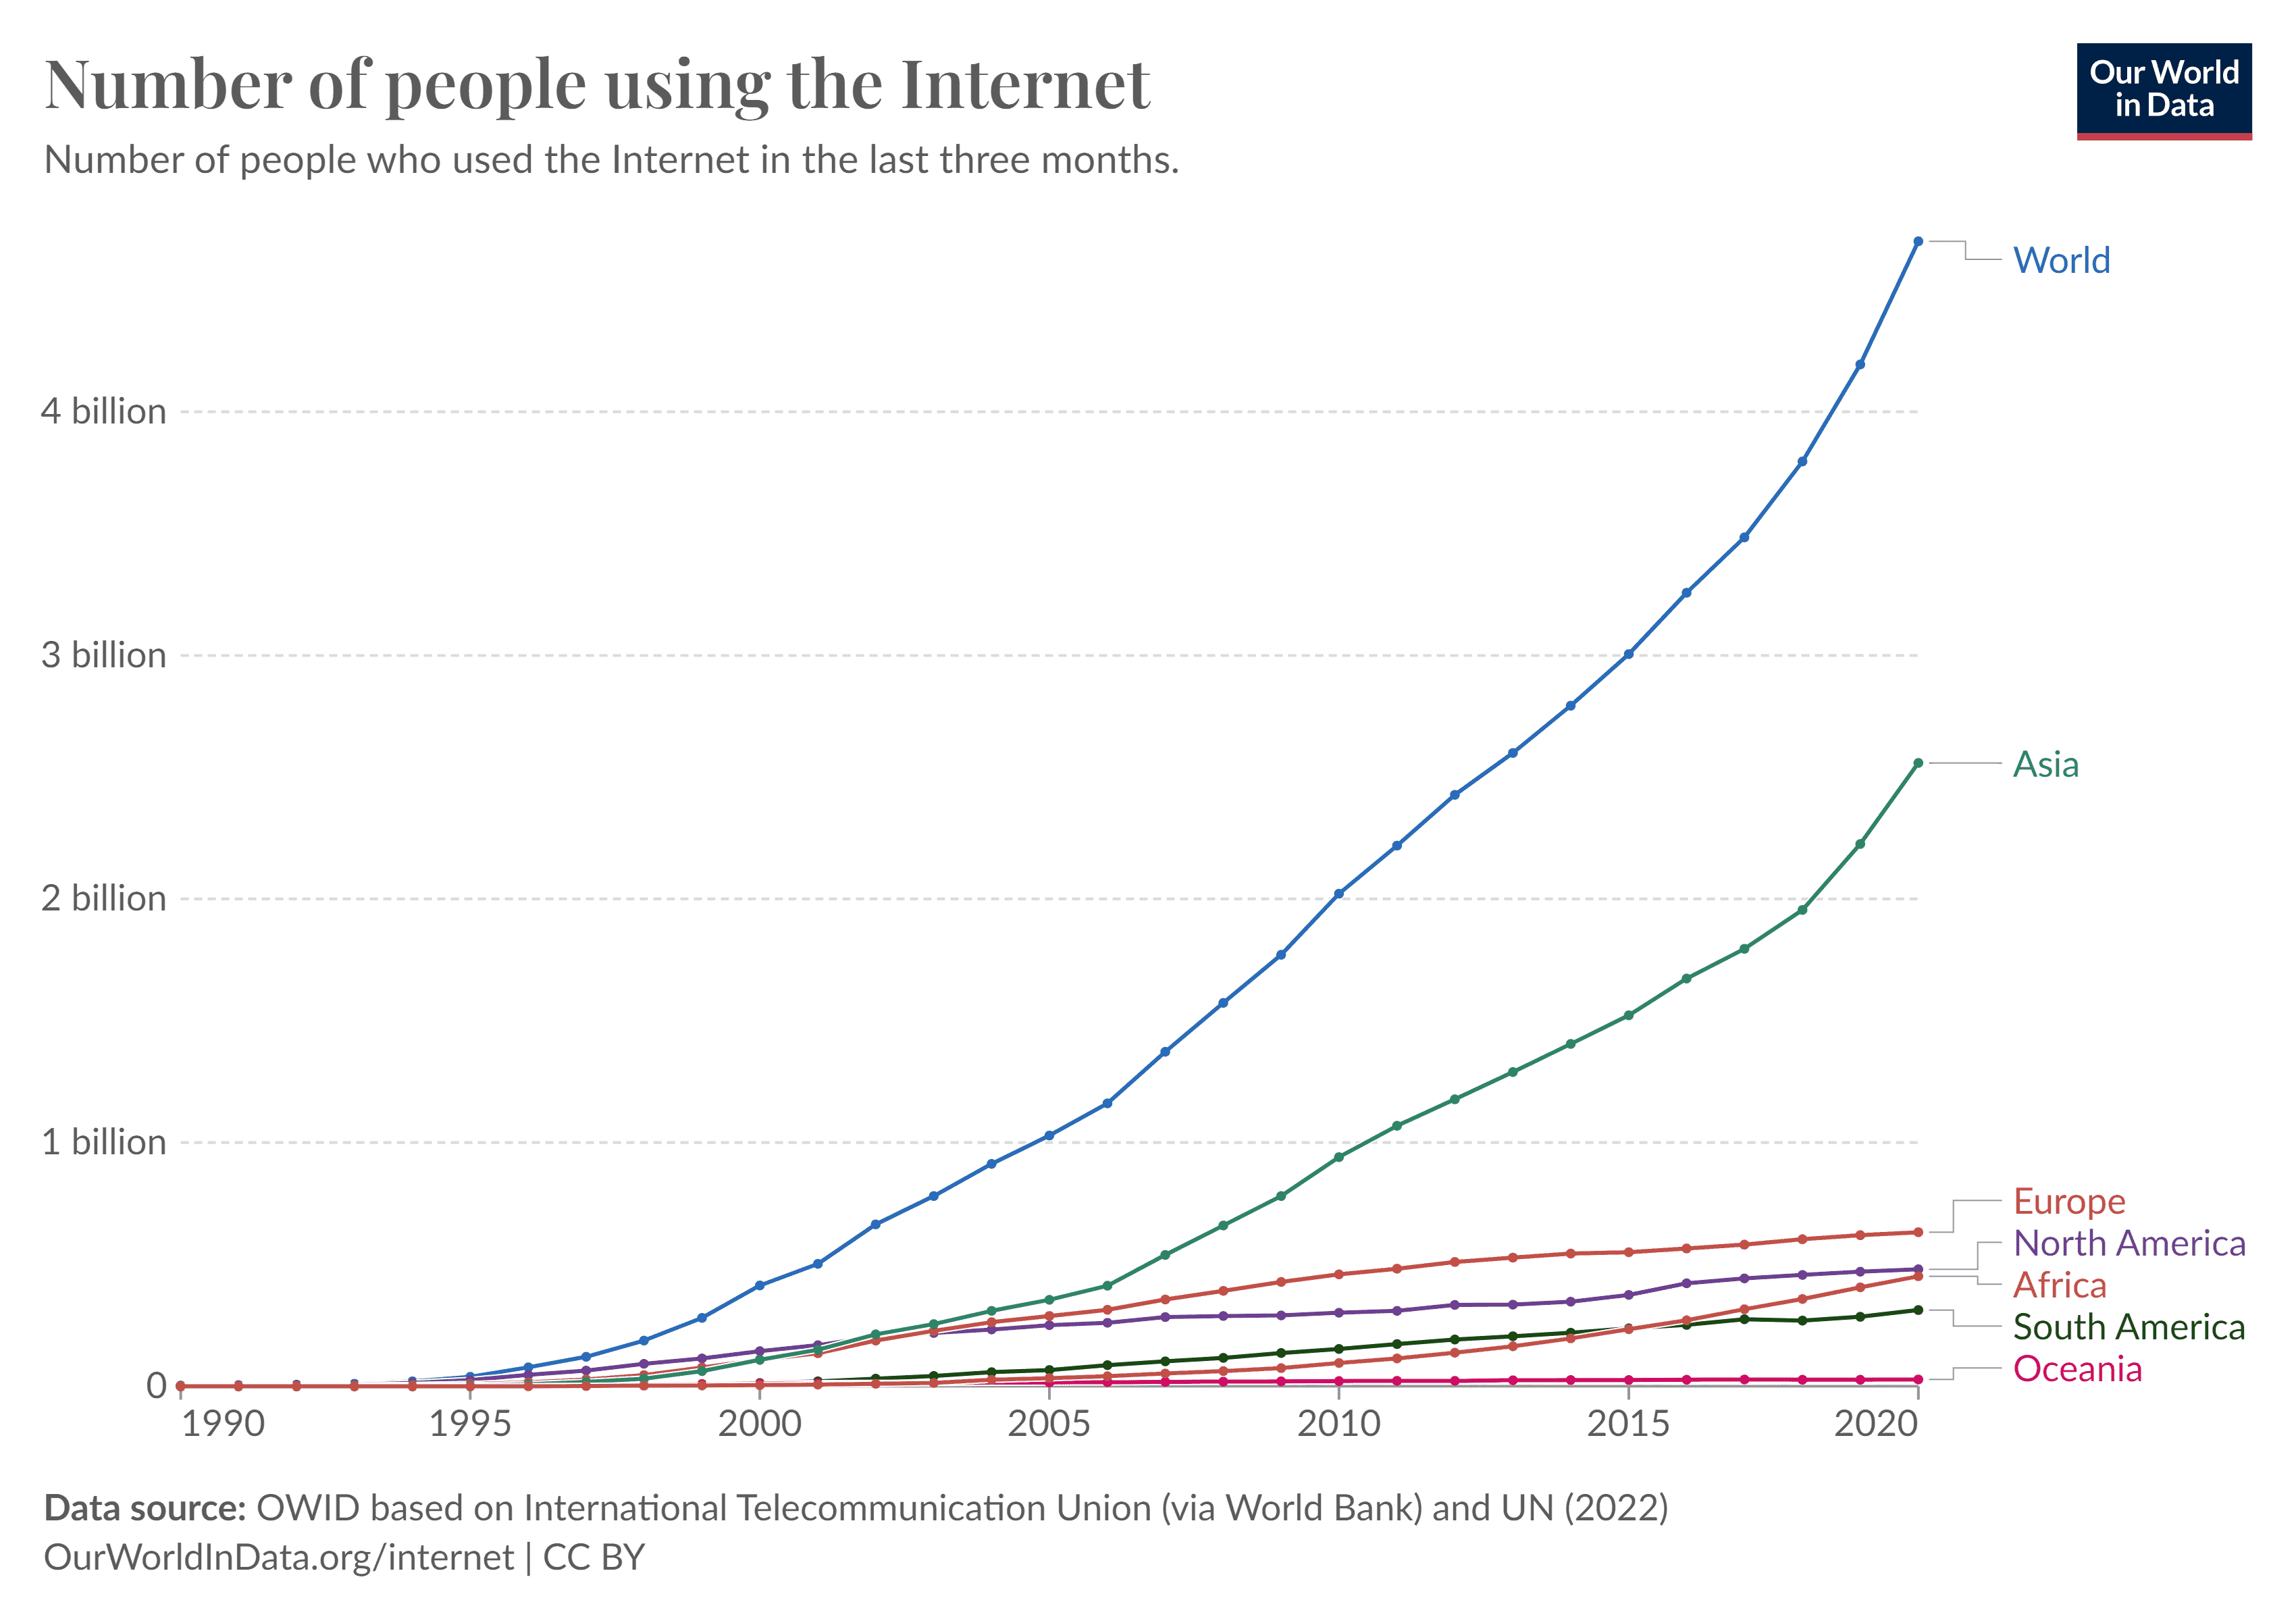
Source: https://ourworldindata.org/grapher/number-of-internet-users
As this article states, the rise of the internet was particularly due to two aspects: access to mobile devices and the advent of social media.
If you wanted to use the internet in the past, you needed to buy a computer or pay an internet cafe to use it for a while. This meant that not everyone could afford to access the internet let alone have an online presence. With the introduction of affordable mobile devices, access to the internet has been democratized. The rise of social media has also resulted in a significant uptake of the internet. With more content being produced and consumed each day, there's an ever-growing demand to host, store and deliver them from the platforms to the end users, thus only increasing electricity consumption. It's already projected that by 2025, we'll be generating about 181 zettabytes of data!
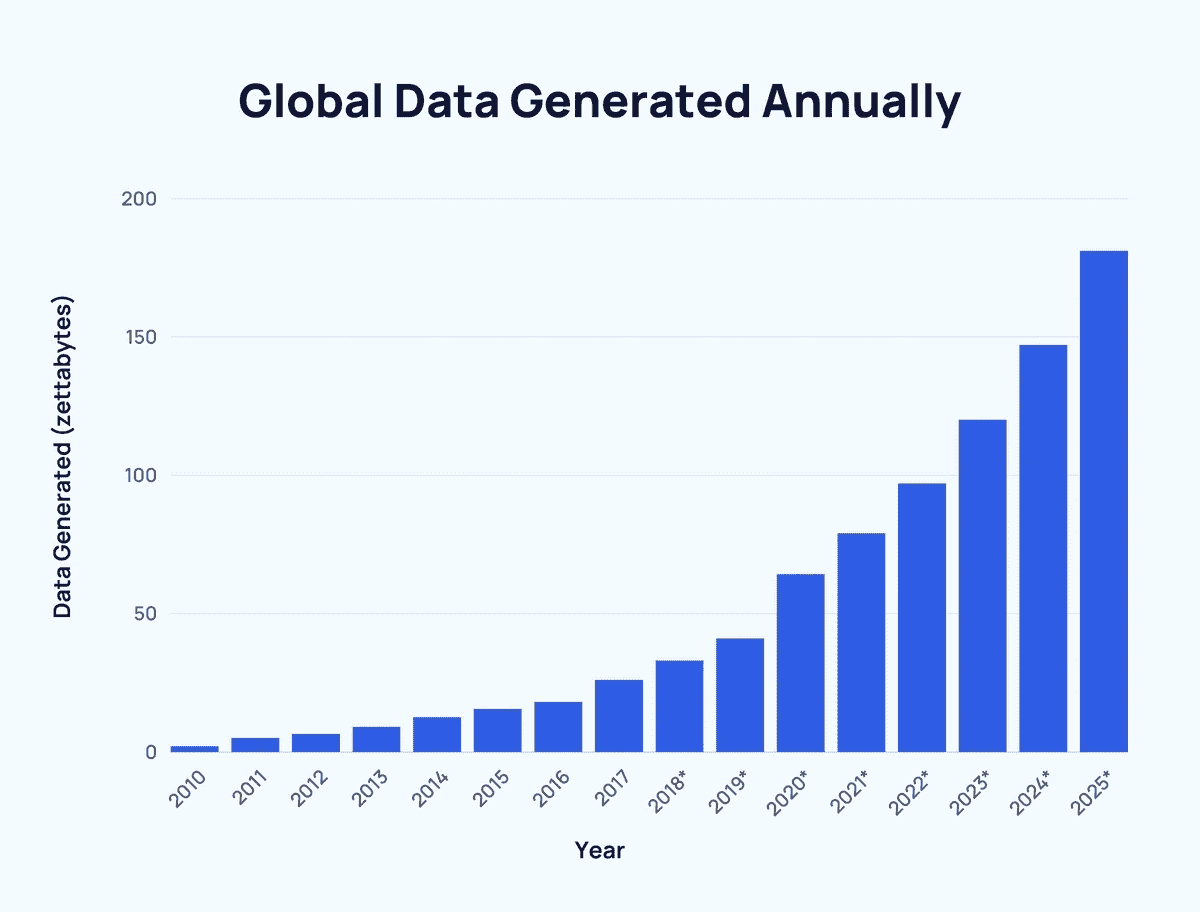
Source: https://explodingtopics.com/blog/data-generated-per-day
The internet currently produces approximately 3.7% of global carbon emissions with an upward trend. It's time we do something about it.
Chapter 5: Moving Ahead
So, now where to from you? Is it the end of web development or consumption? Of course not.
Microsoft has laid out six principles to guide you in what it means to be a sustainable software engineer. They are:
- Carbon efficiency: Build applications that are carbon efficient. Minimize the amount of carbon emitted and if you do emit some, extract the most value out of it.
- Electricity efficiency: Build applications that are energy efficient.
- Carbon awareness: Consume electricity with the lowest carbon intensity.
- Hardware efficiency: Build applications that are hardware efficient.
- Measurement: Improve sustainability through measurement. Software Carbon Intensity (SCI) is proposed to be a better approach for calculating software emissions.
- Climate commitments: Defining the exact mechanism of carbon reduction.
Optimizing for performance
Sustainable web development practices cover recommendations to optimize the system and include things like reducing the data transfer size of the website, preferring a dark colour scheme, choosing simplicity over complexity when architecting and developing the website, making use of caching, hosting the site closest to the users for a shorter data transfer over the wire, and hosting the site on green hosting providers.
Reducing the data transfer size of the website includes practices like reducing heavy page elements like images and videos. If you do need to include them, consider reducing the file size of this content by either using a lossless compression technique, and opting to save the content in the best format. What surprised me after reading the book Sustainable Web Design, is that by blurring the background in an image, we could potentially even reduce the size of the image by half!
HTTP Archive provides an insight on the number of images requested and the size of the images over a period of time. Since 2011, the size of the images transfered has gradually gone up but interestingly, the total number of external images requested by a page has gone down.
JavaScript and CSS files can be bundled and minified. We can even optimize the size of fonts by using something like Font Subsetter to only pick the characters and styles you need out of a font file.
Energy-efficient colour schemes also surprised me! Black uses the least energy while white uses around six times more energy than black. Interestingly enough, blue consumes twice the energy than red and green. It's important to note that this impact is apparent only on OLED displays.
Optimizing for users
We want the best possible experience for our users, but often that comes with a cost. Sustainable web development focuses on asking, “Is this really required?” Bells and whistles might look good but might not always be the most efficient and sustainable form of development.
We also want our users to find what they're looking for faster. This would lead to less time spent consuming content, which leads to less electricity consumed, and less fossil fuels burnt. Good search engine optimization (SEO) and copywriting strategies help deliver relevant content faster to the users.
Reducing our consumption rate
Software programs that demand significant processing resources from the user's device may unintentionally alienate individuals with older or slower hardware, leading to faster battery drain on smartphones and laptops. Additionally, developing web applications that rely on cutting-edge, high-performance devices can contribute to a trend of more frequent disposal of older devices. Even from the consumer's side, we're stuck in this fad of upgrading our smartphones and laptops to the latest and greatest and thus, not end up using our devices for their full lifetime. Since a large amount of carbon (also known as embodied carbon emissions) is generated during manufacturing, it's environmentally wise to change devices less frequently and try to prolong their life as much as possible. For instance, Apple has reported that about 65% of its emissions come from product manufacturing. Samsung reports that their scope 3 emissions are approx. 728 times more than scopes 1 and 2 combined.
Advocacy
Things have moved considerably in this space in the last few years, but even then there might be multiple instances where sustainability is not always the goal. Strong advocacy is needed to push for sustainable software engineering practices and drive some of the practices and principles where see fit. With carbon budgets and regulations being introduced, organisations can take action now and be ahead of the curve, or wait it out and face the inevitable and possibly a sudden change.
Conclusion
Thanks for sticking around till the end. I'll leave you with two philosophies of sustainable software engineering:
- Everyone has a part to play in the climate solution: No matter what your role is, whatever sector or industry you work in, or whatever technology you work on, there's always something you can do to have an impact.
- Sustainability is enough to justify our work: With climate change becoming a pressing issue with each passing day, there shouldn't be any other bigger reason to implement sustainable software engineering practices.
That's it! Thanks for reading.
Footnotes
Estimated CO₂e emissions calculated using ecograder.com. Estimate simplified for comprehensibility. ↩
Assuming the nine other articles are of similar length and have similar images or multimedia content without any caching on repeated visits. Estimate simplified for comprehensibility. ↩
Calculated using websitecarbon.com. ↩