- Published on ·
- Reading time 16 min read
AppDynamics: 13 Concepts That Caught My Attention
A post AppDynamics Implementer Foundations Workshop reflection
Share this page
Introduction
I recently attended the 5-day AppDynamics Implementer Foundations Workshop in Auckland, New Zealand. This course covered on-premise deployment of AppDynamics version 4.5.x and we got an opportunity to do multiple hands-on lab sessions along the way, and get a feel of the product. This article intends to be a reflection of what I learned and some key concepts that stood out for me.
Disclaimer: All views are a personal reflection only. Some information may differ should you compare it with their Software-as-a-Service (SaaS) offering or any other version of the product.
What is AppDynamics?
AppDynamics is an Application Performance Monitoring (APM) solution offering you real-time view of your application and business health. In a nutshell, as David Wadhwani, CEO of AppDynamics shared in a keynote speech, “AppDynamics helps you move fast without breaking things, helps you follow things in an increasingly distributed environment, and lets you focus your teams on what really drives your business.”
Gartner's Magic Quadrant 2019 report for APM puts AppDynamics as a market leader. Gartner defines APM suites as one or more software components that facilitate application monitoring to meet three main functional dimensions: Digital experience monitoring (DEM), Application discovery, tracing and diagnostics (ADTD), and Artificial intelligence for IT operations (AIOps).
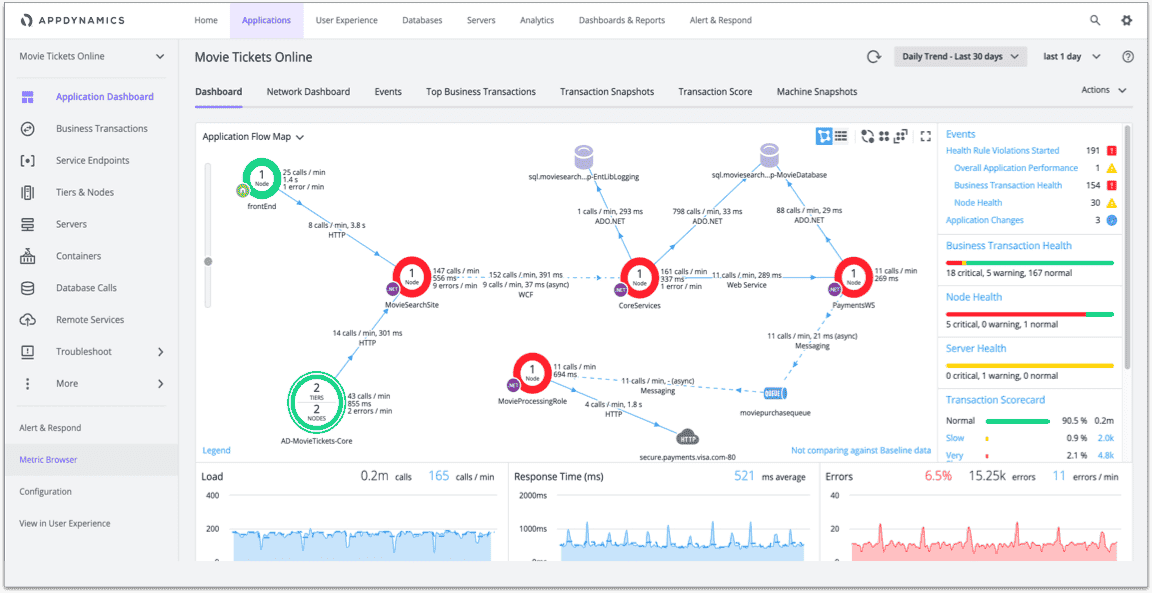
Application Flow Map view from AppDynamics
Their core Application Performance Monitoring (APM) solution does not just give visibility into an organisation's IT ecosystem in the form of a neat Application Flow Map, but it also gives visibility into the lines of code that might be causing the system or service to run slow. With the right Database Agent installed, you can even see the if any database queries are resulting in a performance impact.
With Infrastructure Visibility, you get insights into the server's performance like CPU and memory usage, disk I/O, plus visibility of issues in the network, if any.
End User Monitoring focuses on the customer experience. How do the users use the application? What browsers do most users use? What are the top 5 countries that generate traffic to the website? If the mobile app crashes, do we know what device, the user was using? AppDynamics provides all of that and more! AppDynamics offers Browser RUM, Mobile RUM, Synthetic monitoring and even IoT monitoring.
Finally, Business iQ is an offering to translate metrics collected into insights. It correlates application performance to business outcomes. For instance, if the application performance view tells you that the checkout services of an e-commerce site are running awfully slow, you could correlate that with the business view to see the affect this slowness is having on the sales.
AppDynamics on-premise platform architecture
Let's quickly take a look at AppDynamics' on-premise platform architecture before we look at the 13 concepts that caught my attention.
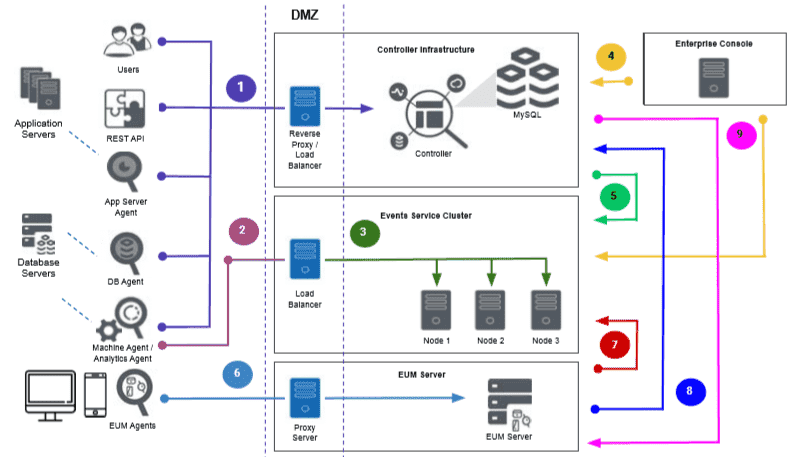
Courtesy of AppDynamics. For more downloadable PDFs, click here.
Enterprise Console
Enterprise Console is the first thing you would install as part of your AppDynamics implementation. Enterprise Console offers a UI through which you can install the Controller and Events Service.
Controller
All agents deployed will collect data and send it to the controller. The Controller offers a UI through which you can view and analyse the data.
Agents
In an AppDynamics deployment, Agents are the elements that are deployed across all the components in your environment that monitor and collect data and send it across to the controller. Because there could be a variety of components in your environment, you'll find different agents for them. For example, you would install a Java Agent to monitor a Java application.
Events Service
Events Service is the data storage facility for the high-volume, performance-intensive unstructured data generated by Application Analytics, Database Visibility, and End User Monitoring. Events Service can be deployed as a single node or as a cluster with three or more nodes which can always be horizontally scaled.
End User Monitoring (EUM) server
EUM collects data from web browsers, mobile apps, and IoT devices, thus allowing you to get insights from the actual user experience. In an on-premise set up, you would need to install the EUM server and Events Service in addition to the Controller and EUM agents, to process and store the data being collected.
What caught my attention?
Here are 13 concepts that intrigued me during this course.
1) SaaS v/s on-premise offering
At the beginning of this article, I mentioned that this workshop was about an on-premise AppDynamics installation. So, let's first understand what are the major differences between the SaaS and on-premise offering, and why you might choose one over the other.
- If you choose to go with the on-premise option, you would need to use your own hardware and be responsible for it's maintenance. Whereas, with the SaaS option, everything is managed for you.
- With the on-premise option, a good amount of time will be spent in capacity planning as each component of the AppDynamics platform has it's own hardware requirements. On the contrary, going with the SaaS option eliminates quite a bit of that effort.
- You would need to plan and implement software upgrades yourselves in an on-premise setup. With SaaS, you automatically get all the upgrades.
- With the on-premise option, you would have to be responsible for scaling and performance. Whereas the SaaS architecture ensures that it can scale for even trillions of metrics per day.
- If there are strict data storage policies to keep the data in-house, then the on-premise offering would be more suitable as you would host all the data yourselves.
- With the move towards AIOps, AppDynamics releases new features to deliver the grand vision of the Central Nervous System. One such SaaS-only feature is a machine learning based Cognition Engine for automatic anomaly detection to identify the root cause of issues down to the line of code and offers meaningful alerting reducing alert fatigue. AppDynamics also introduced Serverless APM for AWS Lambda to monitor and manage Lambda functions which is also only available in their SaaS offering. Basically, if you're after these newer features then you'd have to choose SaaS.
2) Common settings across Agent installation
Over the 5 days, we ended up installing different types of Agents (among other things, of course) — Java Agent, .NET Agent, Machine Agent with Analytics plugin, and the Database Monitoring Agent. I noted that there were a few settings that had the exact same values across all Agents — and this made sense since all the Agents need to communicate with the Controller to post data to it and get the latest configuration. The settings were:
- Account name: Since this is a single tenant set up in a demo environment, we set this to 'customer1' but in a real-world scenario, you'd name this after your client.
- Access key: This can be obtained from the License page. You would want to restrict how you distribute the access key — more about this in the 'License rules' section below.
- Controller host: Since we had a load balancer in front of our controllers (similar to the diagram above), we needed to enter the load balancer's internal fully qualified domain name (FQDN).
- Controller port: The default port number for a Controller is 8090. A full list of port settings can be found here.
3) Difference between Java and .NET Agent
- Let's start with the obvious one — the .NET Agent is used to monitor .NET applications while the Java Agent is used to monitor a Java application.
- You only require one .NET agent per Windows Server even if you want to monitor multiple applications, whereas, you require one Java Agent per Java Virtual Machine (JVM).
- The .NET Agent comes with a .NET machine agent (which is different from a standalone Machine Agent), while the Java Agent doesn't come packaged with anything else.
- The .NET Agent requires Windows Coordinator Service while a Java Agent doesn't depend on any additional service.
- The .NET Agent is GUI based (for IIS applications) while the Java Agent is command line based.
4) License rules
While working with multiple teams to implement AppDynamics, you might find yourself giving out the same access key to many. All the teams may not require to consume all types of license units. For example, the server team would only need to install a Machine Agent but may not require to consume a language specific Agent.
To restrict the use of license units, AppDynamics provides you with License rules. You can create a rule and allocate n number of license units across all the available types for that team.
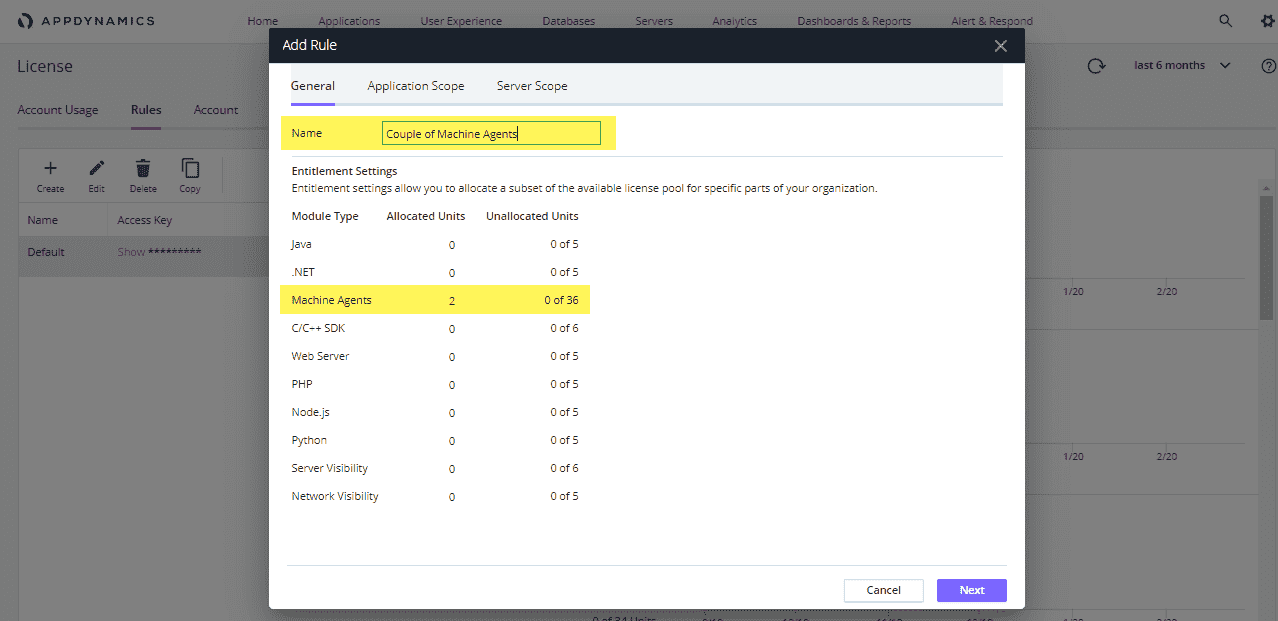
Add license rule dialog box
After creating the rule, you will see it in the list along with its own access key. You can now distribute this access key to the team instead of giving the default one.
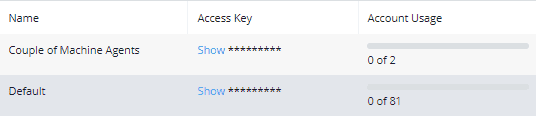
List of license rules
5) Controller Administration Console
To configure Controller's global settings such as metric retention periods, UI notification triggers, tenancy mode, and accounts in multi-tenancy mode, you would need to access the Controller's Administration Console. The URL is http://<Your Controller URL:port number>/controller/admin.jsp. Ensure you logout of the Controller UI, if you're logged in as an account user, before trying to log in to the Administration Console.
Note: It is not recommended to change anything in here except if instructed in the documentation provided or if guided by an AppDynamics representative.
6) Controller availability
In a high availability (HA) scenario, it is recommended that the traffic to the Controller be directed at the reverse proxy/load balancer rather than directly at the controller. So, should the primary Controller go down, the load balancer can direct all Agent communication to the secondary Controller instead. The proxy can monitor the status of the Controller using this address http://<Your Controller URL:port number>/rest/serverstatus which returns an HTTP 503 Service Unavailable response to GET requests, and an XML response with <available>false</available> for a passive/down node.
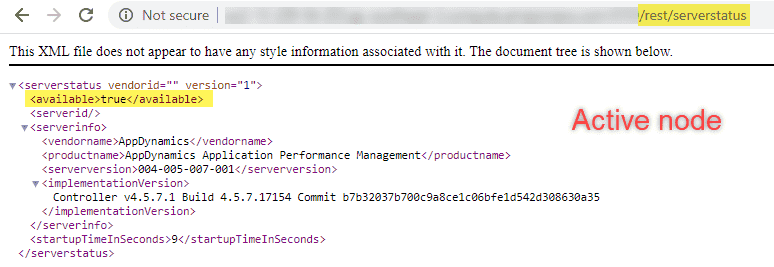
Example of the XML returned from the Controller's monitor endpoint
Note: HA is only available if you're Controller's are set up on Linux machines. The secondary controller must have a HA licence. For a complete list of prerequisites, refer to this article.
7) Enterprise Console and Controller downtime
If the Enterprise Console experiences a downtime, the Controller will not be impacted. However, if the primary Controller (in a high availability scenario) and Enterprise Console is down at the same time, it wouldn't auto failover to the secondary Controller because, by default, in the 4.5.x release the 'Enable auto failover' is auto enabled (as pictured below) in the Enterprise Console — which means it is the Enterprise Console's responsibility to monitor the Controller's and initiate an auto failover when necessary.

By default, in the 4.5.x release the Enable auto failover is auto enabled
The solution to that is the new HA Module that installs the Controller watchdog on the Controller hosts making the Controller hosts now responsible for performing a failover. The HA module is packaged with the Enterprise Console but just isn't enabled by default — although it can be activated anytime as per this article. The HA Module activation will be automated in future Enterprise Console releases.
While we're on the topic, it is also worth noting how the Agent behaves when a Controller is down. If the Controller is unreachable for one minute, the Agents goes on standby during which it doesn't detect any transactions. All metrics not posted to the Controller is stored in the memory. It keeps retrying every minute and resumes function once reconnected.
If this persists for more than three minutes and after three retries, the Agent is muted, all business transactions are disabled, and all metrics prior to three minutes are deleted. And after five minutes, the license is freed for another Agent to use.
8) Authentication provider fallback to local login
By default, AppDynamics is the authentication provider — which means local users and groups that you'd need to configure. You can also configure an LDAP or SAML provider to handle your authentication needs so AppDynamics can only manage the authorization aspect. In case the LDAP or SAML authentication provider is down, AppDynamics will automatically switch to local user logins for authentication seamlessly. As part of the implementation, it is therefore advised to create few local users with the appropriate roles even though you're configuring LDAP/SAML— just as a contingency plan.
9) AppDynamics Query Language (ADQL)
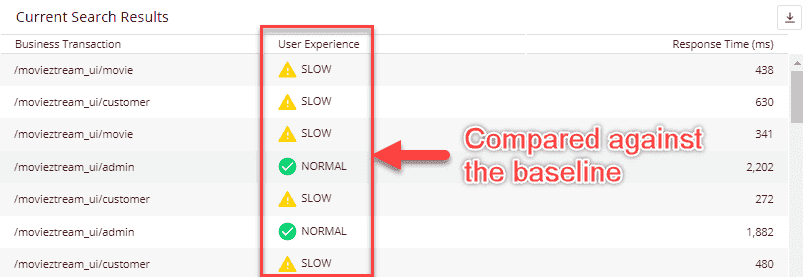
AppDynamics provides their query language to be able to query data available in Application Analytics. For example, I've written a simple ADQL query below:
SELECT transactionName, userExperience, responseTime FROM transactions WHERE responseTime > 200
This gives me all the business transactions with a response time greater than 200ms along with the User Experience (UX). The UX is calculated by AppDyanmics by comparing the response time with the baseline it has maintained.
You can use ADQL to visualize this data as a graph in a widget, and then add this widget to your dashboard. For a full ADQL reference, refer to this page.
10) Browser Real-User Monitoring JavaScript injection
Browser Real-User Monitoring (Browser RUM) allows you to see how your web application is performing from the point of view of a real end user. For this to work, you'd have to inject the JavaScript Agent into your website, and you have 5 ways to achieve this:
- Manual injection: You would need to copy the JavaScript from the Controller UI and paste it into the HTML directly after the
<head>tag. - Automatic injection: This method relies on the server-side app agent injecting the JavaScript at runtime. You would, however, need to specify the business transactions that you'd like automatic injection enabled. Only the Java Agent and .NET Agent supports this.
- Assisted injection using rules (Java only): You tell AppDynamics which Java classes and methods write to the output stream of your application and AppDynamics will intercept those methods and injects the JavaScript Agent into the output stream.
- Assisted injection using attribute: You copy two variables
JS_HEADERandJS_FOOTERinto your page templates. The App Agent then replaces these variables with the required code to load the JavaScript Agent on your website. - Container-based injection: You can use directives to inject the JavaScript Agent into the response of your website if you're using Nginx or Apache as a web container or reverse proxy.
Further details on how the JavaScript Agent works and detailed can be found here.
11) Upgrading the platform components
On day 4, we upgraded all the components that we had installed. The high-level steps was to: 1) back up everything— common convention is to back up all the components before backing up the Controller and finally the Enterprise Console, and 2) upgrade the components — order is Enterprise Console, Events Service, EUM Server, and finally the Controller.
We also upgraded all the Agents we had installed — Java Agent, .NET Agent, Machine Agent with Analytics plugin, and Database Monitoring Agent. Note: Upgrading an Agent may require an outage as we need to restart the application. Overall, I found that the process would require a lot of planning (in a real-life scenario) even before you can get to actually upgrading. Depending on what components you're upgrading, this may involve quite a bit of manual effort.
12) Email templates
Email notifications can make use of email templates should a health rule get violated. Email templates can be customized using variables — predefined and custom — so the same email template with different values can be sent to the recipients based on the trigger. Templates use Velocity to process these variables and add the correct value in the right places. Sample email template below:
...
Email notification for "${latestEvent.application.name}" application on the "${policy.name}" event notification.
...
Please see this article ${potentialResolutionSteps} from the KB for next steps.
...
From the email above, ${latestEvent.application.name} and ${policy.name} are predefined variables which relate to the application name set in AppDynamics and the health rule policy respectively. On the other hand, ${potentialResolutionSteps} is a custom variable which can be set while configuring the email notification. Assuming we set the value of our custom variable to https://shopztream.confluence.com/wiki/actions/slow-checkout-process for the policy “Slow checkout process” of the “ShopZtream” application, this is what the final email message would look like in the recipients mailbox:
...
Email notification for "ShopZtream" application on the "Slow checkout process" event notification.
...
Please see this article https://shopztream.confluence.com/wiki/actions/slow-checkout-process from the KB for next steps.
...
13) Extensions
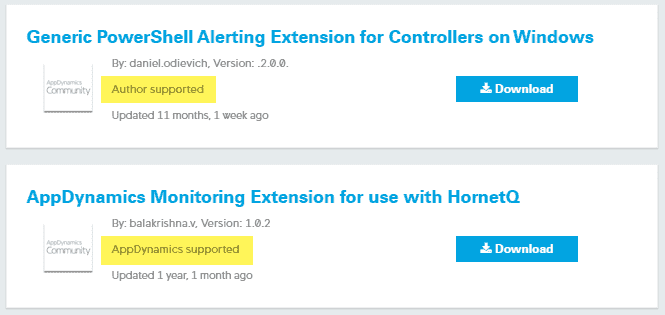
Extensions, as the name suggests, extend the functionality of AppDynamics so it can be used with an even larger set of technologies. You either build your own Extension or use one that's available on the AppDynamics Exchange site. Note, if the Extension is AppDynamics supported then you can open a support case with the AppDynamics support team, but if it's Author supported then you can't.
Where to get started?
- Give AppDynamics a try with a 15-day free trial. A hands-on experience is always the best way to learn.
- During this trial, you may want to refer to their technical documentation site to read the detailed steps on how to set up each component.
- If you have any questions along the way, feel free to post a question on their community-driven site.
- If you're interested in attending the Implementer Foundations Workshop, check out this page to know when you may be able to attend next.
Summary
Alright, time for a quick recap —
- We started off with an introduction to AppDynamics and what the core APM offerings are.
- We quickly followed that with the on-premise platform architecture and a quick summary of each component.
- To some degree of detail, we then looked at 13 concepts that caught my attention.
- Finally, we noted what the next steps would be like if you'd like to get started with AppDynamics.
That's it! Thanks for reading.